class: title-slide, middle, left ## Session 4: Data preparation and how to go from Luminex machine to [`covidClassifyR`](https://shaziaruybal.shinyapps.io/covidclassifyr) Shiny app ### Dr Shazia Ruybal-Pesántez Presented at the [covidClassifyR Shiny app workshop](https://shaziaruybal.github.io/covidClassifyR-workshop) for researchers from PNGIMR and partner institutions 2022-03-11 --- class: left # Recap -- ### <svg aria-hidden="true" role="img" viewBox="0 0 448 512" style="height:1em;width:0.88em;vertical-align:-0.125em;margin-left:auto;margin-right:auto;font-size:inherit;fill:currentColor;overflow:visible;position:relative;"><path d="M400 480H48c-26.51 0-48-21.49-48-48V80c0-26.51 21.49-48 48-48h352c26.51 0 48 21.49 48 48v352c0 26.51-21.49 48-48 48zm-204.686-98.059l184-184c6.248-6.248 6.248-16.379 0-22.627l-22.627-22.627c-6.248-6.248-16.379-6.249-22.628 0L184 302.745l-70.059-70.059c-6.248-6.248-16.379-6.248-22.628 0l-22.627 22.627c-6.248 6.248-6.248 16.379 0 22.627l104 104c6.249 6.25 16.379 6.25 22.628.001z"/></svg> **[Session 1](https://shaziaruybal.github.io/covidClassifyR-workshop/sessions/2022-03-10-session1/index.html)** gave you an overview of the Luminex technology and the COVID-19 multi-antigen serological assay that was established in PNG -- ### <svg aria-hidden="true" role="img" viewBox="0 0 448 512" style="height:1em;width:0.88em;vertical-align:-0.125em;margin-left:auto;margin-right:auto;font-size:inherit;fill:currentColor;overflow:visible;position:relative;"><path d="M400 480H48c-26.51 0-48-21.49-48-48V80c0-26.51 21.49-48 48-48h352c26.51 0 48 21.49 48 48v352c0 26.51-21.49 48-48 48zm-204.686-98.059l184-184c6.248-6.248 6.248-16.379 0-22.627l-22.627-22.627c-6.248-6.248-16.379-6.249-22.628 0L184 302.745l-70.059-70.059c-6.248-6.248-16.379-6.248-22.628 0l-22.627 22.627c-6.248 6.248-6.248 16.379 0 22.627l104 104c6.249 6.25 16.379 6.25 22.628.001z"/></svg> **Session 2** gave you an overview of the purpose of serosurveillance and insights into the COVID-19 sero-surveys that have been carried out in PNG -- ### <svg aria-hidden="true" role="img" viewBox="0 0 448 512" style="height:1em;width:0.88em;vertical-align:-0.125em;margin-left:auto;margin-right:auto;font-size:inherit;fill:currentColor;overflow:visible;position:relative;"><path d="M400 480H48c-26.51 0-48-21.49-48-48V80c0-26.51 21.49-48 48-48h352c26.51 0 48 21.49 48 48v352c0 26.51-21.49 48-48 48zm-204.686-98.059l184-184c6.248-6.248 6.248-16.379 0-22.627l-22.627-22.627c-6.248-6.248-16.379-6.249-22.628 0L184 302.745l-70.059-70.059c-6.248-6.248-16.379-6.248-22.628 0l-22.627 22.627c-6.248 6.248-6.248 16.379 0 22.627l104 104c6.249 6.25 16.379 6.25 22.628.001z"/></svg> **[Session 3](https://shaziaruybal.github.io/covidClassifyR-workshop/sessions/2022-03-10-session3/index.html)** gave you an overview of the [`covidClassifyR`](https://shaziaruybal.shinyapps.io/covidclassifyr) Shiny app -- .footnote[ For all the workshop materials see the [workshop website <svg aria-hidden="true" role="img" viewBox="0 0 512 512" style="height:1em;width:1em;vertical-align:-0.125em;margin-left:auto;margin-right:auto;font-size:inherit;fill:currentColor;overflow:visible;position:relative;"><path d="M432,320H400a16,16,0,0,0-16,16V448H64V128H208a16,16,0,0,0,16-16V80a16,16,0,0,0-16-16H48A48,48,0,0,0,0,112V464a48,48,0,0,0,48,48H400a48,48,0,0,0,48-48V336A16,16,0,0,0,432,320ZM488,0h-128c-21.37,0-32.05,25.91-17,41l35.73,35.73L135,320.37a24,24,0,0,0,0,34L157.67,377a24,24,0,0,0,34,0L435.28,133.32,471,169c15,15,41,4.5,41-17V24A24,24,0,0,0,488,0Z"/></svg>](https://shaziaruybal.github.io/covidClassifyR-workshop/materials.html) ] --- class: center # <svg aria-hidden="true" role="img" viewBox="0 0 640 512" style="height:1em;width:1.25em;vertical-align:-0.125em;margin-left:auto;margin-right:auto;font-size:inherit;fill:currentColor;overflow:visible;position:relative;"><path d="M96 64h448v352h64V40c0-22.06-17.94-40-40-40H72C49.94 0 32 17.94 32 40v376h64V64zm528 384H480v-64H288v64H16c-8.84 0-16 7.16-16 16v32c0 8.84 7.16 16 16 16h608c8.84 0 16-7.16 16-16v-32c0-8.84-7.16-16-16-16z"/></svg> # Today we will cover: -- ### How to prepare your raw data file and plate layout -- ### Do's and dont's -- ### Importing the raw data -- ### You can find the app [here <svg aria-hidden="true" role="img" viewBox="0 0 512 512" style="height:1em;width:1em;vertical-align:-0.125em;margin-left:auto;margin-right:auto;font-size:inherit;fill:currentColor;overflow:visible;position:relative;"><path d="M432,320H400a16,16,0,0,0-16,16V448H64V128H208a16,16,0,0,0,16-16V80a16,16,0,0,0-16-16H48A48,48,0,0,0,0,112V464a48,48,0,0,0,48,48H400a48,48,0,0,0,48-48V336A16,16,0,0,0,432,320ZM488,0h-128c-21.37,0-32.05,25.91-17,41l35.73,35.73L135,320.37a24,24,0,0,0,0,34L157.67,377a24,24,0,0,0,34,0L435.28,133.32,471,169c15,15,41,4.5,41-17V24A24,24,0,0,0,488,0Z"/></svg>](https://shaziaruybal.shinyapps.io/covidClassifyR) --- class: inverse, middle, center # <svg aria-hidden="true" role="img" viewBox="0 0 384 512" style="height:1em;width:0.75em;vertical-align:-0.125em;margin-left:auto;margin-right:auto;font-size:inherit;fill:currentColor;overflow:visible;position:relative;"><path d="M224 136V0H24C10.7 0 0 10.7 0 24v464c0 13.3 10.7 24 24 24h336c13.3 0 24-10.7 24-24V160H248c-13.2 0-24-10.8-24-24zm60.1 106.5L224 336l60.1 93.5c5.1 8-.6 18.5-10.1 18.5h-34.9c-4.4 0-8.5-2.4-10.6-6.3C208.9 405.5 192 373 192 373c-6.4 14.8-10 20-36.6 68.8-2.1 3.9-6.1 6.3-10.5 6.3H110c-9.5 0-15.2-10.5-10.1-18.5l60.3-93.5-60.3-93.5c-5.2-8 .6-18.5 10.1-18.5h34.8c4.4 0 8.5 2.4 10.6 6.3 26.1 48.8 20 33.6 36.6 68.5 0 0 6.1-11.7 36.6-68.5 2.1-3.9 6.2-6.3 10.6-6.3H274c9.5-.1 15.2 10.4 10.1 18.4zM384 121.9v6.1H256V0h6.1c6.4 0 12.5 2.5 17 7l97.9 98c4.5 4.5 7 10.6 7 16.9z"/></svg> ## Preparing your data --- name: data-reqs # Raw data requirements #### Your raw data should be exported from the Luminex machine in .xlsx format -- #### Make sure that your sample labels in the Luminex machine protocol are as follows: - **Standards:** labels start with ‘S’ and then a number as required (e.g. S1, S2, S3 or Standard1, Standard2, Standard3) - **Blanks:** labels start with ‘B’ and then a number as required if there is more than one blank sample (.e.g ‘B1’, ‘B2’, or ‘Blank 1’, ‘Blank2’ etc). - **Unknown samples:** do not include individual sample labels, leave them as ‘Unknown’ -- **<svg aria-hidden="true" role="img" viewBox="0 0 352 512" style="height:1em;width:0.69em;vertical-align:-0.125em;margin-left:auto;margin-right:auto;font-size:inherit;fill:currentColor;overflow:visible;position:relative;"><path d="M96.06 454.35c.01 6.29 1.87 12.45 5.36 17.69l17.09 25.69a31.99 31.99 0 0 0 26.64 14.28h61.71a31.99 31.99 0 0 0 26.64-14.28l17.09-25.69a31.989 31.989 0 0 0 5.36-17.69l.04-38.35H96.01l.05 38.35zM0 176c0 44.37 16.45 84.85 43.56 115.78 16.52 18.85 42.36 58.23 52.21 91.45.04.26.07.52.11.78h160.24c.04-.26.07-.51.11-.78 9.85-33.22 35.69-72.6 52.21-91.45C335.55 260.85 352 220.37 352 176 352 78.61 272.91-.3 175.45 0 73.44.31 0 82.97 0 176zm176-80c-44.11 0-80 35.89-80 80 0 8.84-7.16 16-16 16s-16-7.16-16-16c0-61.76 50.24-112 112-112 8.84 0 16 7.16 16 16s-7.16 16-16 16z"/></svg> Tip:** Label your antigens the same way in all plate runs. You can do this by setting up the protocol directly on the Luminex machine and using it for all your plate runs. -- **<svg aria-hidden="true" role="img" viewBox="0 0 352 512" style="height:1em;width:0.69em;vertical-align:-0.125em;margin-left:auto;margin-right:auto;font-size:inherit;fill:currentColor;overflow:visible;position:relative;"><path d="M96.06 454.35c.01 6.29 1.87 12.45 5.36 17.69l17.09 25.69a31.99 31.99 0 0 0 26.64 14.28h61.71a31.99 31.99 0 0 0 26.64-14.28l17.09-25.69a31.989 31.989 0 0 0 5.36-17.69l.04-38.35H96.01l.05 38.35zM0 176c0 44.37 16.45 84.85 43.56 115.78 16.52 18.85 42.36 58.23 52.21 91.45.04.26.07.52.11.78h160.24c.04-.26.07-.51.11-.78 9.85-33.22 35.69-72.6 52.21-91.45C335.55 260.85 352 220.37 352 176 352 78.61 272.91-.3 175.45 0 73.44.31 0 82.97 0 176zm176-80c-44.11 0-80 35.89-80 80 0 8.84-7.16 16-16 16s-16-7.16-16-16c0-61.76 50.24-112 112-112 8.84 0 16 7.16 16 16s-7.16 16-16 16z"/></svg> Tip:** the Shiny app will interpret anything that starts with "S" as a Standard and will use the antibody data from these samples to calculate your standard curve. Similarly, it will interpret anything that starts with "B" as a Blank sample and anything else as an "Unknown". --- name: plate-reqs # Plate layout requirements #### Your plate layout should be in .xlsx format -- For each 96-well plate that you run on the Luminex machine, prepare a plate layout that includes the sample labels that will match your raw data. By supplying the plate layout, the Shiny application will match the raw data to the corresponding sample based on the plate layout that you import. -- Make sure that your sample labels in the plate layout are as follows: - **Standards:** labels start with ‘S’ and then a number as required (e.g. S1, S2, S3 or Standard1, Standard2, Standard3) - **Blanks:** labels start with ‘B’ and then a number as required if there is more than one blank sample (.e.g ‘B1’, ‘B2’, or ‘Blank 1’, ‘Blank2’ etc). - **Unknown samples:** label your unknown samples according to your specific sample codes (e.g. ABC001, ABC002) -- **<svg aria-hidden="true" role="img" viewBox="0 0 352 512" style="height:1em;width:0.69em;vertical-align:-0.125em;margin-left:auto;margin-right:auto;font-size:inherit;fill:currentColor;overflow:visible;position:relative;"><path d="M96.06 454.35c.01 6.29 1.87 12.45 5.36 17.69l17.09 25.69a31.99 31.99 0 0 0 26.64 14.28h61.71a31.99 31.99 0 0 0 26.64-14.28l17.09-25.69a31.989 31.989 0 0 0 5.36-17.69l.04-38.35H96.01l.05 38.35zM0 176c0 44.37 16.45 84.85 43.56 115.78 16.52 18.85 42.36 58.23 52.21 91.45.04.26.07.52.11.78h160.24c.04-.26.07-.51.11-.78 9.85-33.22 35.69-72.6 52.21-91.45C335.55 260.85 352 220.37 352 176 352 78.61 272.91-.3 175.45 0 73.44.31 0 82.97 0 176zm176-80c-44.11 0-80 35.89-80 80 0 8.84-7.16 16-16 16s-16-7.16-16-16c0-61.76 50.24-112 112-112 8.84 0 16 7.16 16 16s-7.16 16-16 16z"/></svg> Tip:** make sure that there are no extra cells filled out other than the plate wells and sample names. -- **<svg aria-hidden="true" role="img" viewBox="0 0 352 512" style="height:1em;width:0.69em;vertical-align:-0.125em;margin-left:auto;margin-right:auto;font-size:inherit;fill:currentColor;overflow:visible;position:relative;"><path d="M96.06 454.35c.01 6.29 1.87 12.45 5.36 17.69l17.09 25.69a31.99 31.99 0 0 0 26.64 14.28h61.71a31.99 31.99 0 0 0 26.64-14.28l17.09-25.69a31.989 31.989 0 0 0 5.36-17.69l.04-38.35H96.01l.05 38.35zM0 176c0 44.37 16.45 84.85 43.56 115.78 16.52 18.85 42.36 58.23 52.21 91.45.04.26.07.52.11.78h160.24c.04-.26.07-.51.11-.78 9.85-33.22 35.69-72.6 52.21-91.45C335.55 260.85 352 220.37 352 176 352 78.61 272.91-.3 175.45 0 73.44.31 0 82.97 0 176zm176-80c-44.11 0-80 35.89-80 80 0 8.84-7.16 16-16 16s-16-7.16-16-16c0-61.76 50.24-112 112-112 8.84 0 16 7.16 16 16s-7.16 16-16 16z"/></svg> Tip:** Use the example plate layout as a template to fill in with your sample details. -- **<svg aria-hidden="true" role="img" viewBox="0 0 352 512" style="height:1em;width:0.69em;vertical-align:-0.125em;margin-left:auto;margin-right:auto;font-size:inherit;fill:currentColor;overflow:visible;position:relative;"><path d="M96.06 454.35c.01 6.29 1.87 12.45 5.36 17.69l17.09 25.69a31.99 31.99 0 0 0 26.64 14.28h61.71a31.99 31.99 0 0 0 26.64-14.28l17.09-25.69a31.989 31.989 0 0 0 5.36-17.69l.04-38.35H96.01l.05 38.35zM0 176c0 44.37 16.45 84.85 43.56 115.78 16.52 18.85 42.36 58.23 52.21 91.45.04.26.07.52.11.78h160.24c.04-.26.07-.51.11-.78 9.85-33.22 35.69-72.6 52.21-91.45C335.55 260.85 352 220.37 352 176 352 78.61 272.91-.3 175.45 0 73.44.31 0 82.97 0 176zm176-80c-44.11 0-80 35.89-80 80 0 8.84-7.16 16-16 16s-16-7.16-16-16c0-61.76 50.24-112 112-112 8.84 0 16 7.16 16 16s-7.16 16-16 16z"/></svg> Tip:** If you haven’t run a full plate, you can leave the wells with no samples completely blank (i.e. no labels). -- **<svg aria-hidden="true" role="img" viewBox="0 0 352 512" style="height:1em;width:0.69em;vertical-align:-0.125em;margin-left:auto;margin-right:auto;font-size:inherit;fill:currentColor;overflow:visible;position:relative;"><path d="M96.06 454.35c.01 6.29 1.87 12.45 5.36 17.69l17.09 25.69a31.99 31.99 0 0 0 26.64 14.28h61.71a31.99 31.99 0 0 0 26.64-14.28l17.09-25.69a31.989 31.989 0 0 0 5.36-17.69l.04-38.35H96.01l.05 38.35zM0 176c0 44.37 16.45 84.85 43.56 115.78 16.52 18.85 42.36 58.23 52.21 91.45.04.26.07.52.11.78h160.24c.04-.26.07-.51.11-.78 9.85-33.22 35.69-72.6 52.21-91.45C335.55 260.85 352 220.37 352 176 352 78.61 272.91-.3 175.45 0 73.44.31 0 82.97 0 176zm176-80c-44.11 0-80 35.89-80 80 0 8.84-7.16 16-16 16s-16-7.16-16-16c0-61.76 50.24-112 112-112 8.84 0 16 7.16 16 16s-7.16 16-16 16z"/></svg> Tip:** Make sure that the word “Plate” is included in the first column, as the app expects this in order to determine the position of each sample and match it to the raw data outputs. --- class: inverse, middle, center # <svg aria-hidden="true" role="img" viewBox="0 0 384 512" style="height:1em;width:0.75em;vertical-align:-0.125em;margin-left:auto;margin-right:auto;font-size:inherit;fill:currentColor;overflow:visible;position:relative;"><path d="M224 136V0H24C10.7 0 0 10.7 0 24v464c0 13.3 10.7 24 24 24h336c13.3 0 24-10.7 24-24V160H248c-13.2 0-24-10.8-24-24zm60.1 106.5L224 336l60.1 93.5c5.1 8-.6 18.5-10.1 18.5h-34.9c-4.4 0-8.5-2.4-10.6-6.3C208.9 405.5 192 373 192 373c-6.4 14.8-10 20-36.6 68.8-2.1 3.9-6.1 6.3-10.5 6.3H110c-9.5 0-15.2-10.5-10.1-18.5l60.3-93.5-60.3-93.5c-5.2-8 .6-18.5 10.1-18.5h34.8c4.4 0 8.5 2.4 10.6 6.3 26.1 48.8 20 33.6 36.6 68.5 0 0 6.1-11.7 36.6-68.5 2.1-3.9 6.2-6.3 10.6-6.3H274c9.5-.1 15.2 10.4 10.1 18.4zM384 121.9v6.1H256V0h6.1c6.4 0 12.5 2.5 17 7l97.9 98c4.5 4.5 7 10.6 7 16.9z"/></svg> ## Download the example data [here <svg aria-hidden="true" role="img" viewBox="0 0 512 512" style="height:1em;width:1em;vertical-align:-0.125em;margin-left:auto;margin-right:auto;font-size:inherit;fill:currentColor;overflow:visible;position:relative;"><path d="M432,320H400a16,16,0,0,0-16,16V448H64V128H208a16,16,0,0,0,16-16V80a16,16,0,0,0-16-16H48A48,48,0,0,0,0,112V464a48,48,0,0,0,48,48H400a48,48,0,0,0,48-48V336A16,16,0,0,0,432,320ZM488,0h-128c-21.37,0-32.05,25.91-17,41l35.73,35.73L135,320.37a24,24,0,0,0,0,34L157.67,377a24,24,0,0,0,34,0L435.28,133.32,471,169c15,15,41,4.5,41-17V24A24,24,0,0,0,488,0Z"/></svg>](https://shaziaruybal.shinyapps.io/covidClassifyR/_w_8c7cb1cd/example_data.zip) --- # <svg aria-hidden="true" role="img" viewBox="0 0 384 512" style="height:1em;width:0.75em;vertical-align:-0.125em;margin-left:auto;margin-right:auto;font-size:inherit;fill:currentColor;overflow:visible;position:relative;"><path d="M224 136V0H24C10.7 0 0 10.7 0 24v464c0 13.3 10.7 24 24 24h336c13.3 0 24-10.7 24-24V160H248c-13.2 0-24-10.8-24-24zm60.1 106.5L224 336l60.1 93.5c5.1 8-.6 18.5-10.1 18.5h-34.9c-4.4 0-8.5-2.4-10.6-6.3C208.9 405.5 192 373 192 373c-6.4 14.8-10 20-36.6 68.8-2.1 3.9-6.1 6.3-10.5 6.3H110c-9.5 0-15.2-10.5-10.1-18.5l60.3-93.5-60.3-93.5c-5.2-8 .6-18.5 10.1-18.5h34.8c4.4 0 8.5 2.4 10.6 6.3 26.1 48.8 20 33.6 36.6 68.5 0 0 6.1-11.7 36.6-68.5 2.1-3.9 6.2-6.3 10.6-6.3H274c9.5-.1 15.2 10.4 10.1 18.4zM384 121.9v6.1H256V0h6.1c6.4 0 12.5 2.5 17 7l97.9 98c4.5 4.5 7 10.6 7 16.9z"/></svg> Example raw data .xlsx 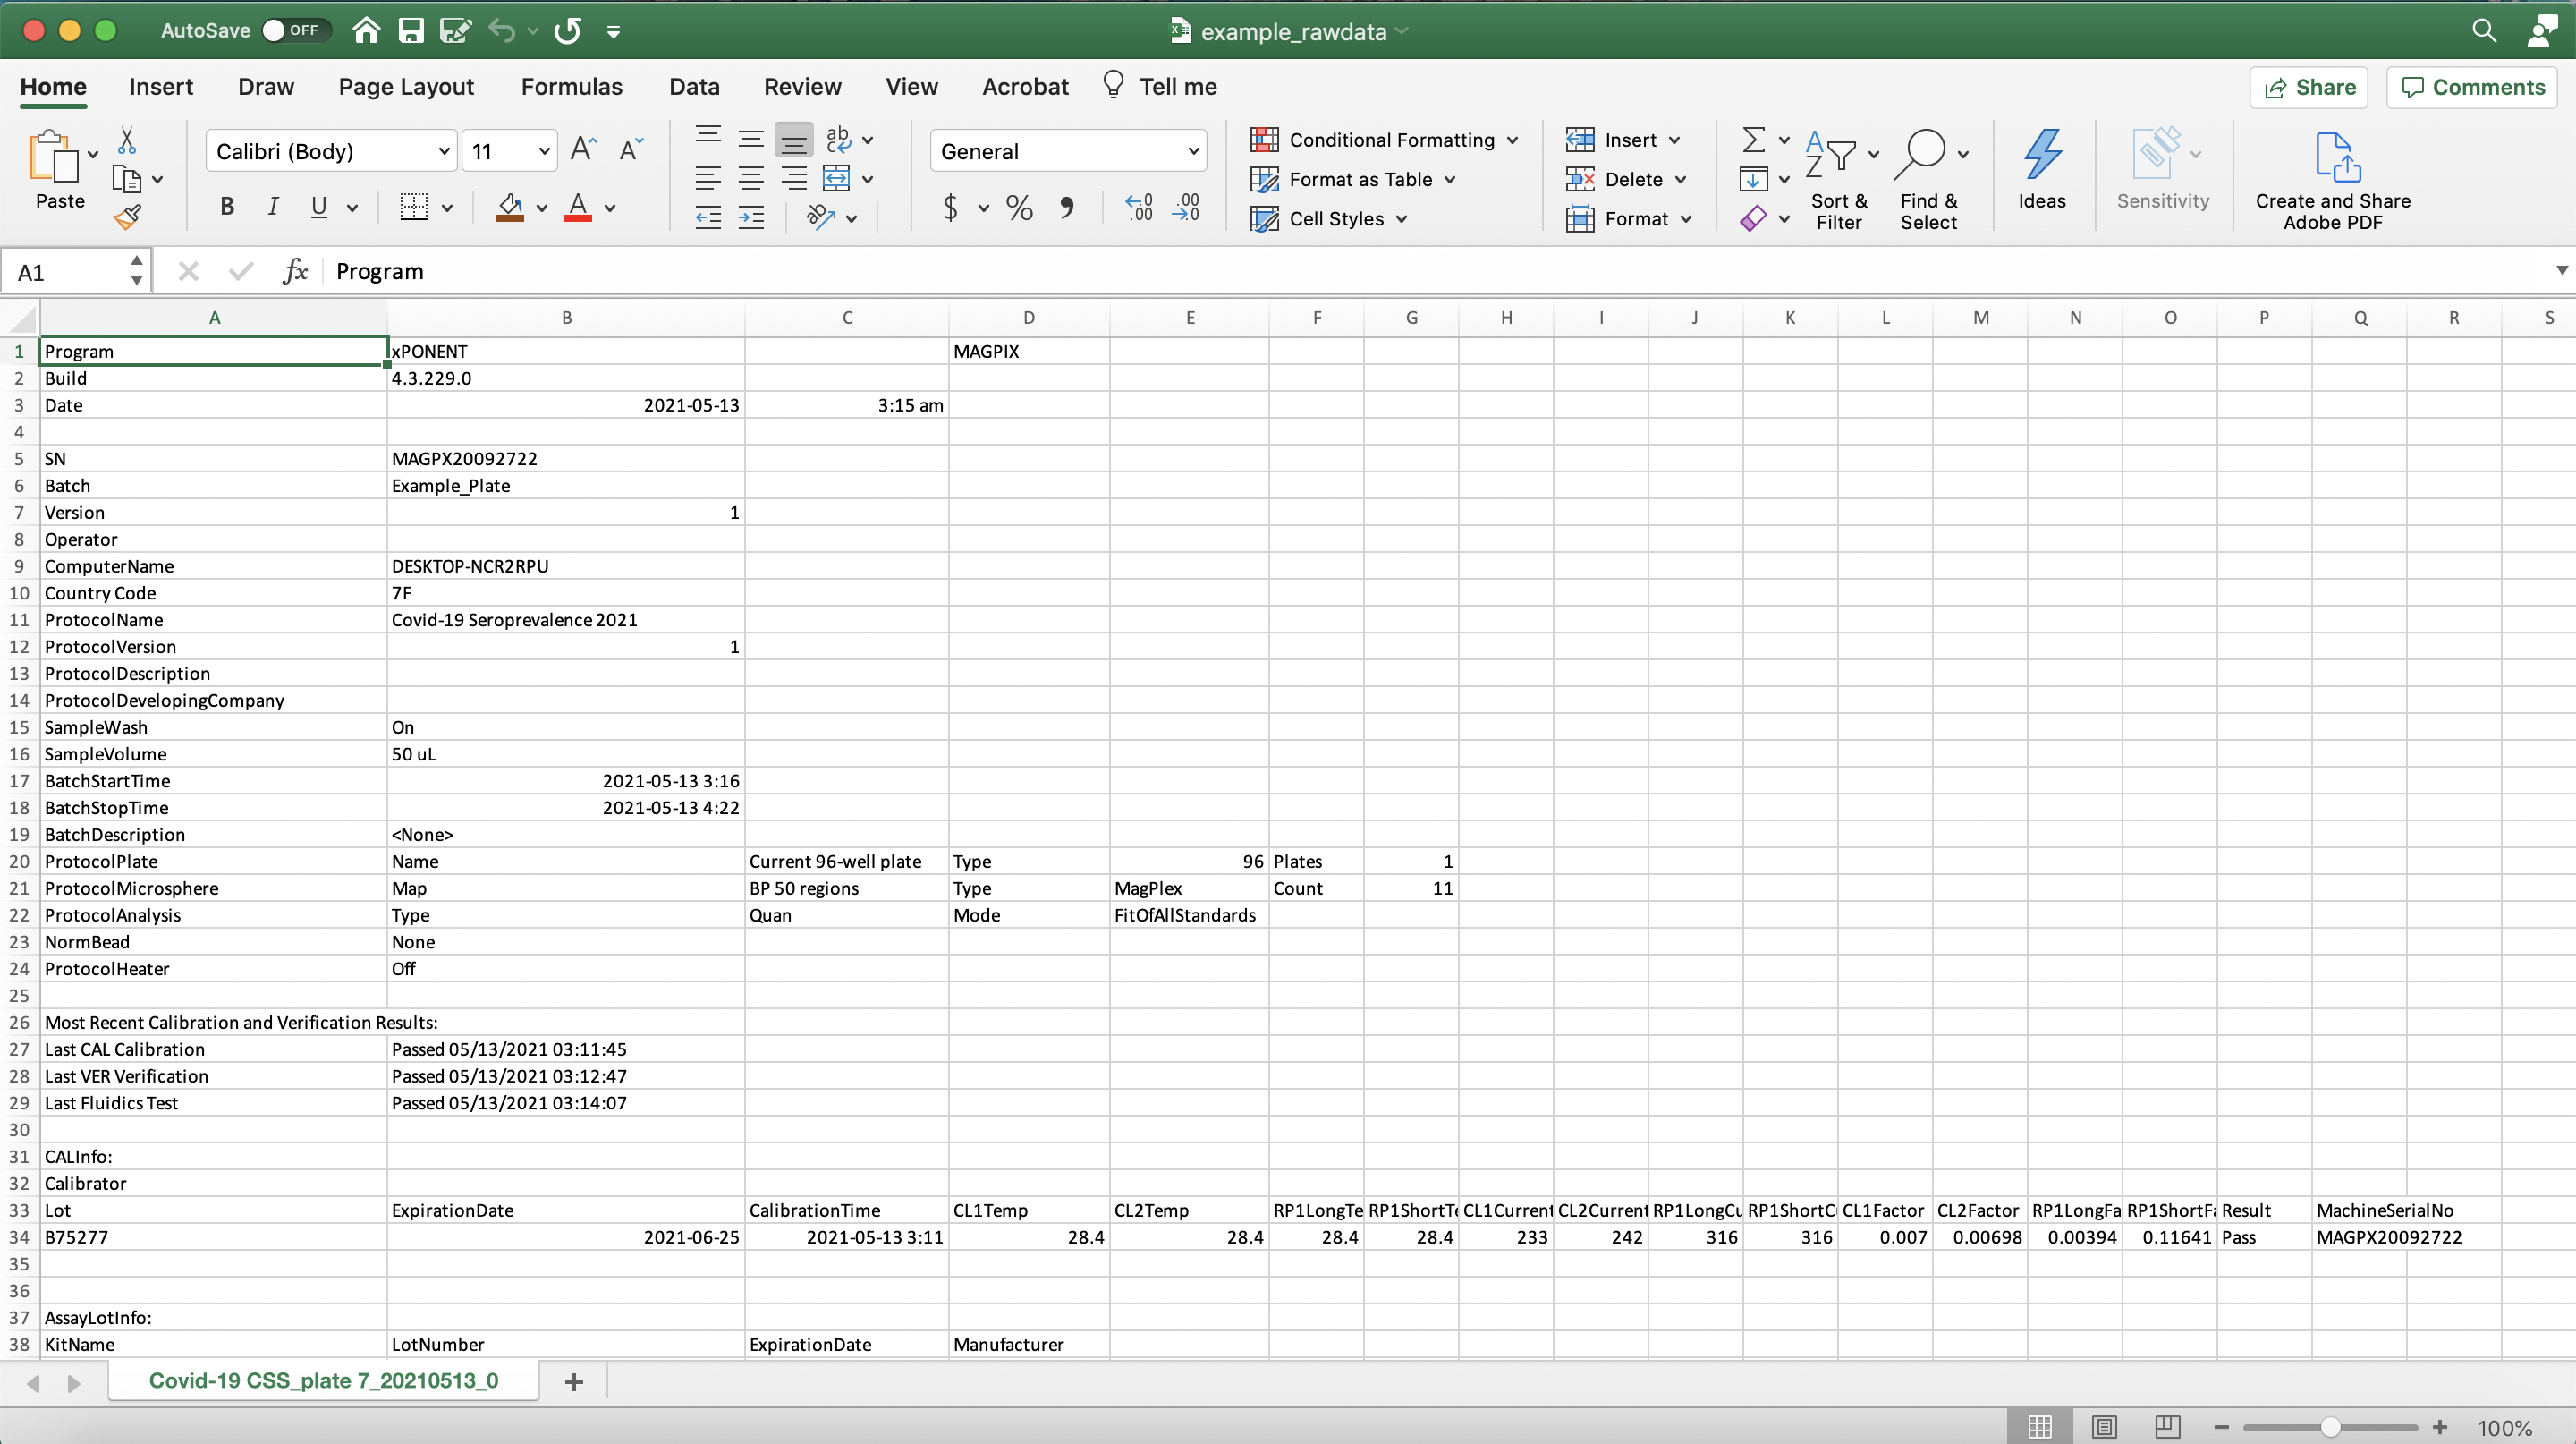 --- # <svg aria-hidden="true" role="img" viewBox="0 0 384 512" style="height:1em;width:0.75em;vertical-align:-0.125em;margin-left:auto;margin-right:auto;font-size:inherit;fill:currentColor;overflow:visible;position:relative;"><path d="M224 136V0H24C10.7 0 0 10.7 0 24v464c0 13.3 10.7 24 24 24h336c13.3 0 24-10.7 24-24V160H248c-13.2 0-24-10.8-24-24zm60.1 106.5L224 336l60.1 93.5c5.1 8-.6 18.5-10.1 18.5h-34.9c-4.4 0-8.5-2.4-10.6-6.3C208.9 405.5 192 373 192 373c-6.4 14.8-10 20-36.6 68.8-2.1 3.9-6.1 6.3-10.5 6.3H110c-9.5 0-15.2-10.5-10.1-18.5l60.3-93.5-60.3-93.5c-5.2-8 .6-18.5 10.1-18.5h34.8c4.4 0 8.5 2.4 10.6 6.3 26.1 48.8 20 33.6 36.6 68.5 0 0 6.1-11.7 36.6-68.5 2.1-3.9 6.2-6.3 10.6-6.3H274c9.5-.1 15.2 10.4 10.1 18.4zM384 121.9v6.1H256V0h6.1c6.4 0 12.5 2.5 17 7l97.9 98c4.5 4.5 7 10.6 7 16.9z"/></svg> Example plate layout .xlsx 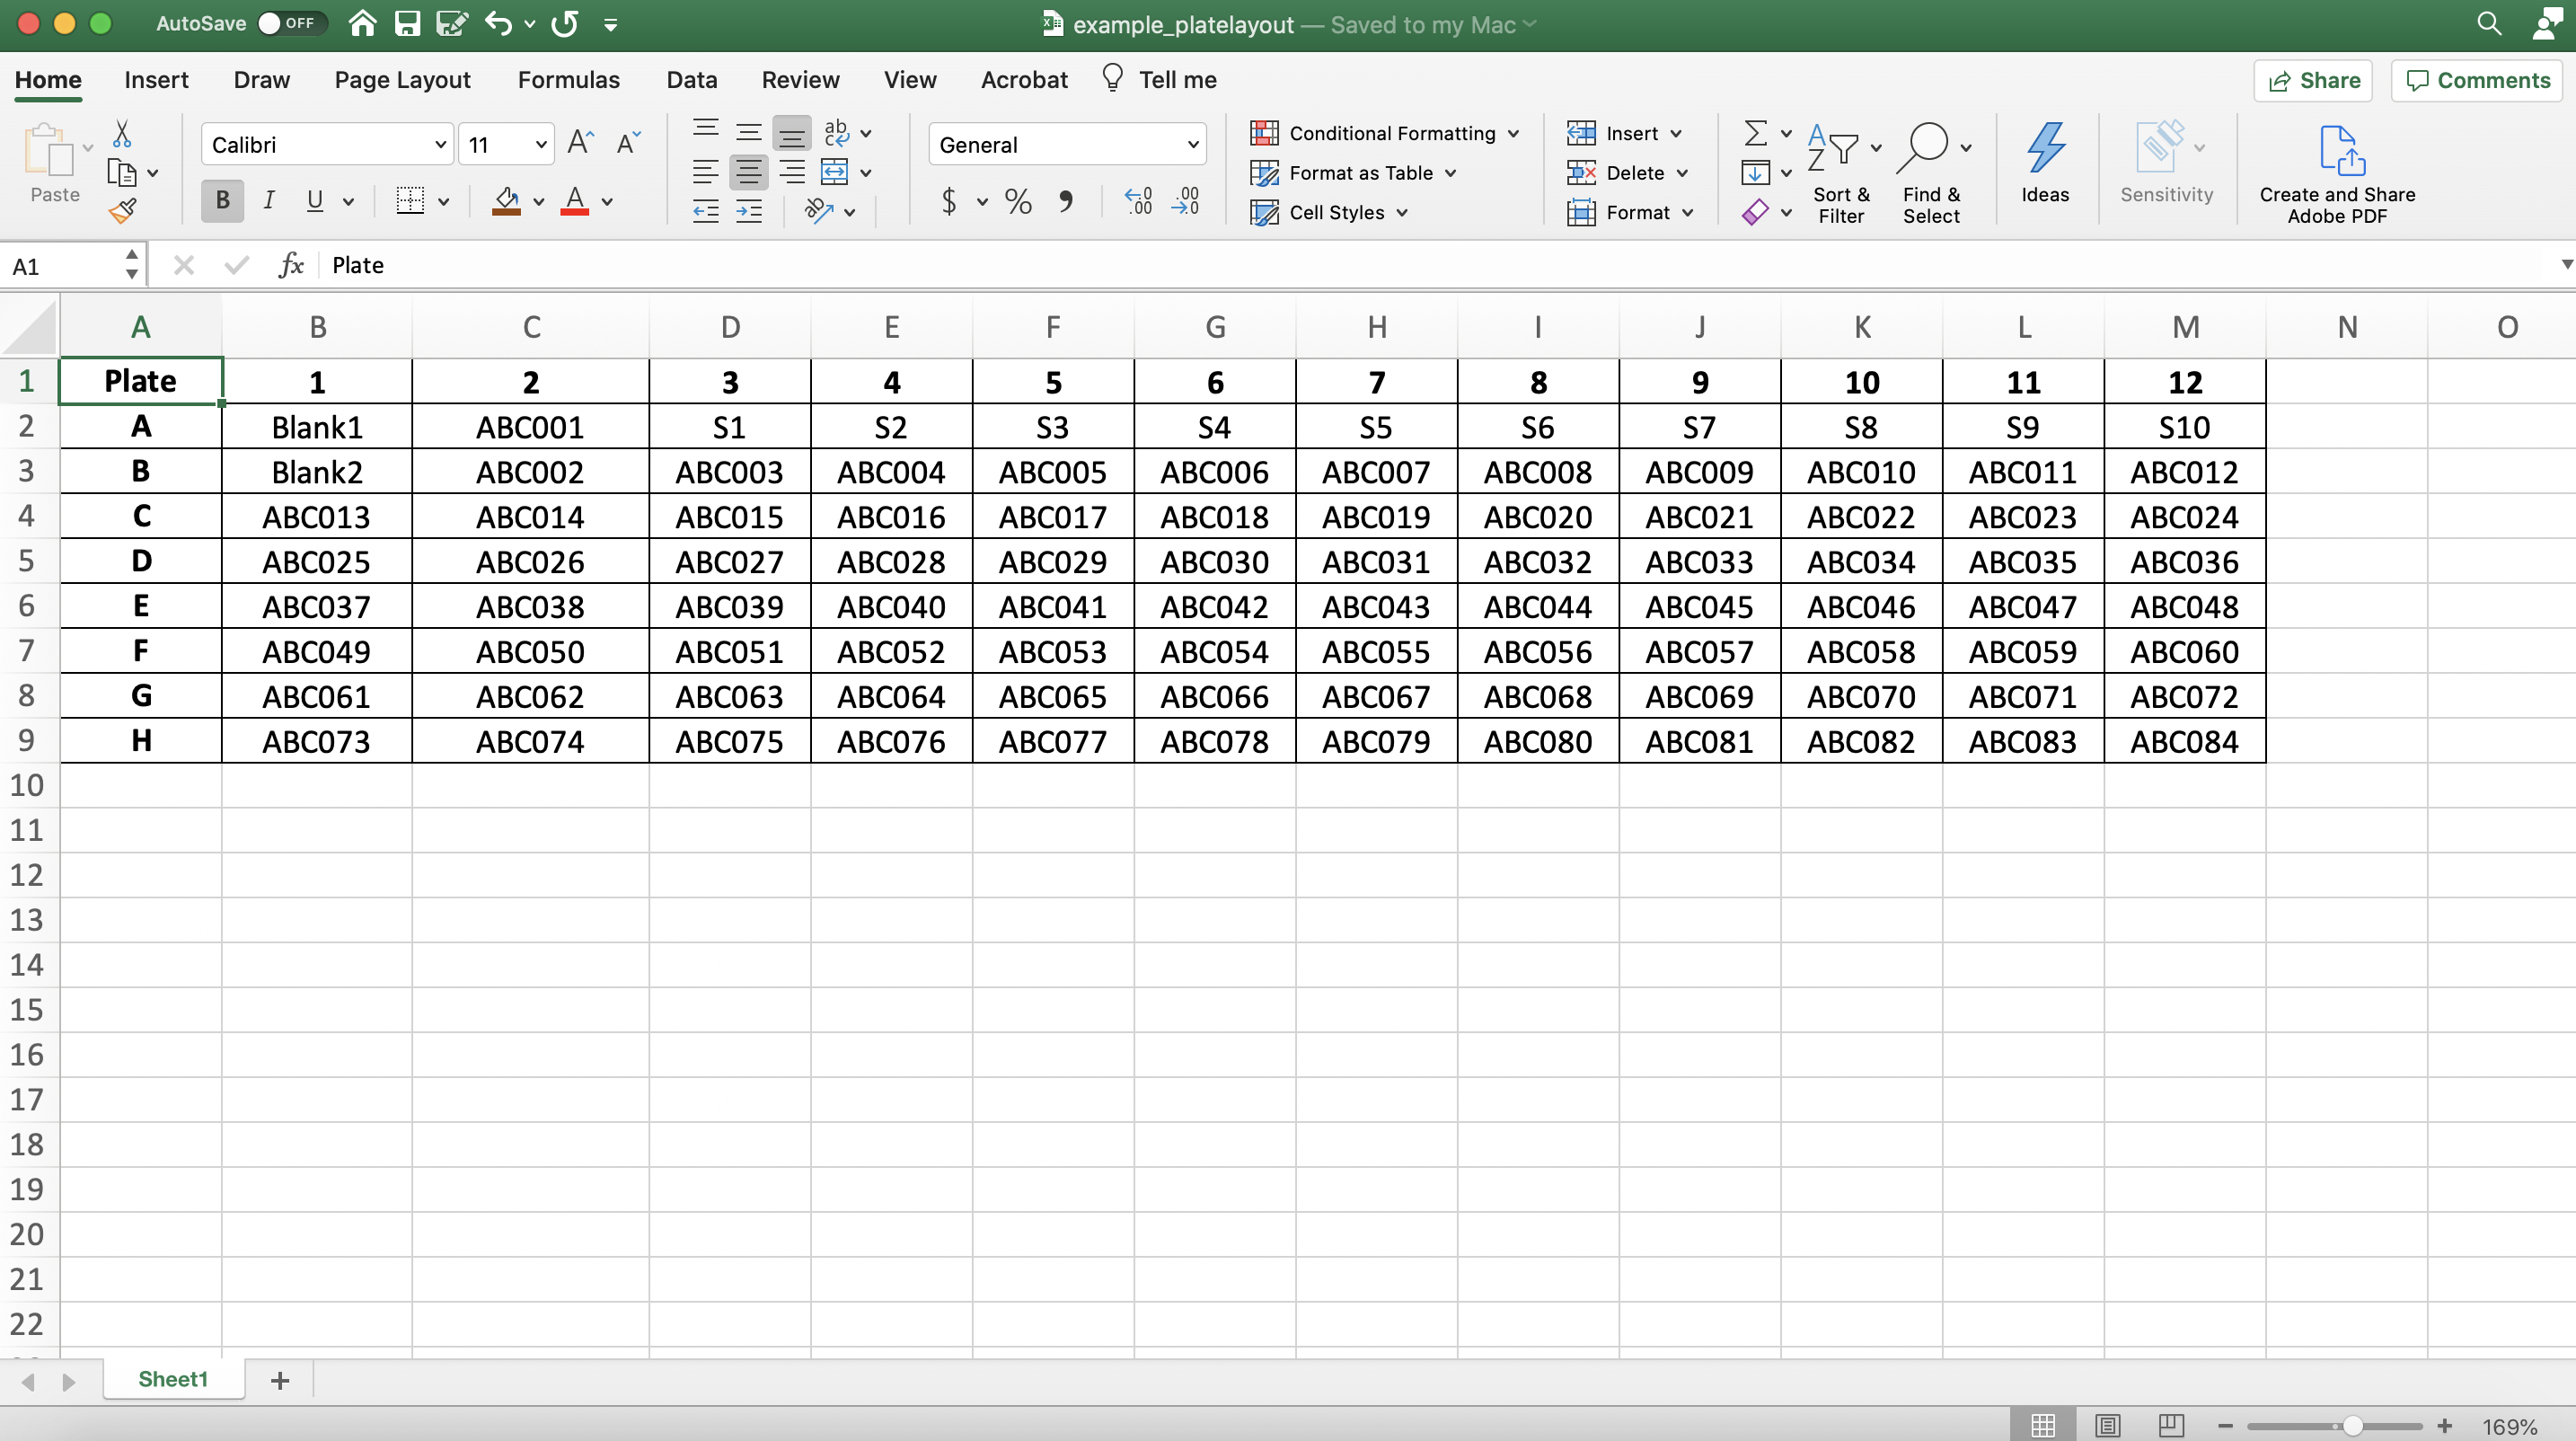 --- # <svg aria-hidden="true" role="img" viewBox="0 0 576 512" style="height:1em;width:1.12em;vertical-align:-0.125em;margin-left:auto;margin-right:auto;font-size:inherit;fill:currentColor;overflow:visible;position:relative;"><path d="M542.22 32.05c-54.8 3.11-163.72 14.43-230.96 55.59-4.64 2.84-7.27 7.89-7.27 13.17v363.87c0 11.55 12.63 18.85 23.28 13.49 69.18-34.82 169.23-44.32 218.7-46.92 16.89-.89 30.02-14.43 30.02-30.66V62.75c.01-17.71-15.35-31.74-33.77-30.7zM264.73 87.64C197.5 46.48 88.58 35.17 33.78 32.05 15.36 31.01 0 45.04 0 62.75V400.6c0 16.24 13.13 29.78 30.02 30.66 49.49 2.6 149.59 12.11 218.77 46.95 10.62 5.35 23.21-1.94 23.21-13.46V100.63c0-5.29-2.62-10.14-7.27-12.99z"/></svg> Quiz -- ### <svg aria-hidden="true" role="img" viewBox="0 0 512 512" style="height:1em;width:1em;vertical-align:-0.125em;margin-left:auto;margin-right:auto;font-size:inherit;fill:currentColor;overflow:visible;position:relative;"><path d="M504 256c0 136.997-111.043 248-248 248S8 392.997 8 256C8 119.083 119.043 8 256 8s248 111.083 248 248zM262.655 90c-54.497 0-89.255 22.957-116.549 63.758-3.536 5.286-2.353 12.415 2.715 16.258l34.699 26.31c5.205 3.947 12.621 3.008 16.665-2.122 17.864-22.658 30.113-35.797 57.303-35.797 20.429 0 45.698 13.148 45.698 32.958 0 14.976-12.363 22.667-32.534 33.976C247.128 238.528 216 254.941 216 296v4c0 6.627 5.373 12 12 12h56c6.627 0 12-5.373 12-12v-1.333c0-28.462 83.186-29.647 83.186-106.667 0-58.002-60.165-102-116.531-102zM256 338c-25.365 0-46 20.635-46 46 0 25.364 20.635 46 46 46s46-20.636 46-46c0-25.365-20.635-46-46-46z"/></svg> How do you need to label your standards? -- <svg aria-hidden="true" role="img" viewBox="0 0 448 512" style="height:1em;width:0.88em;vertical-align:-0.125em;margin-left:auto;margin-right:auto;font-size:inherit;fill:currentColor;overflow:visible;position:relative;"><path d="M400 480H48c-26.51 0-48-21.49-48-48V80c0-26.51 21.49-48 48-48h352c26.51 0 48 21.49 48 48v352c0 26.51-21.49 48-48 48zm-204.686-98.059l184-184c6.248-6.248 6.248-16.379 0-22.627l-22.627-22.627c-6.248-6.248-16.379-6.249-22.628 0L184 302.745l-70.059-70.059c-6.248-6.248-16.379-6.248-22.628 0l-22.627 22.627c-6.248 6.248-6.248 16.379 0 22.627l104 104c6.249 6.25 16.379 6.25 22.628.001z"/></svg> You need to label them starting with "S" -- ### <svg aria-hidden="true" role="img" viewBox="0 0 512 512" style="height:1em;width:1em;vertical-align:-0.125em;margin-left:auto;margin-right:auto;font-size:inherit;fill:currentColor;overflow:visible;position:relative;"><path d="M504 256c0 136.997-111.043 248-248 248S8 392.997 8 256C8 119.083 119.043 8 256 8s248 111.083 248 248zM262.655 90c-54.497 0-89.255 22.957-116.549 63.758-3.536 5.286-2.353 12.415 2.715 16.258l34.699 26.31c5.205 3.947 12.621 3.008 16.665-2.122 17.864-22.658 30.113-35.797 57.303-35.797 20.429 0 45.698 13.148 45.698 32.958 0 14.976-12.363 22.667-32.534 33.976C247.128 238.528 216 254.941 216 296v4c0 6.627 5.373 12 12 12h56c6.627 0 12-5.373 12-12v-1.333c0-28.462 83.186-29.647 83.186-106.667 0-58.002-60.165-102-116.531-102zM256 338c-25.365 0-46 20.635-46 46 0 25.364 20.635 46 46 46s46-20.636 46-46c0-25.365-20.635-46-46-46z"/></svg> What would you do if you have more than one blank sample? -- <svg aria-hidden="true" role="img" viewBox="0 0 448 512" style="height:1em;width:0.88em;vertical-align:-0.125em;margin-left:auto;margin-right:auto;font-size:inherit;fill:currentColor;overflow:visible;position:relative;"><path d="M400 480H48c-26.51 0-48-21.49-48-48V80c0-26.51 21.49-48 48-48h352c26.51 0 48 21.49 48 48v352c0 26.51-21.49 48-48 48zm-204.686-98.059l184-184c6.248-6.248 6.248-16.379 0-22.627l-22.627-22.627c-6.248-6.248-16.379-6.249-22.628 0L184 302.745l-70.059-70.059c-6.248-6.248-16.379-6.248-22.628 0l-22.627 22.627c-6.248 6.248-6.248 16.379 0 22.627l104 104c6.249 6.25 16.379 6.25 22.628.001z"/></svg> Label them with sequential numbers (e.g. Blank1, Blank2, etc) -- ### <svg aria-hidden="true" role="img" viewBox="0 0 512 512" style="height:1em;width:1em;vertical-align:-0.125em;margin-left:auto;margin-right:auto;font-size:inherit;fill:currentColor;overflow:visible;position:relative;"><path d="M504 256c0 136.997-111.043 248-248 248S8 392.997 8 256C8 119.083 119.043 8 256 8s248 111.083 248 248zM262.655 90c-54.497 0-89.255 22.957-116.549 63.758-3.536 5.286-2.353 12.415 2.715 16.258l34.699 26.31c5.205 3.947 12.621 3.008 16.665-2.122 17.864-22.658 30.113-35.797 57.303-35.797 20.429 0 45.698 13.148 45.698 32.958 0 14.976-12.363 22.667-32.534 33.976C247.128 238.528 216 254.941 216 296v4c0 6.627 5.373 12 12 12h56c6.627 0 12-5.373 12-12v-1.333c0-28.462 83.186-29.647 83.186-106.667 0-58.002-60.165-102-116.531-102zM256 338c-25.365 0-46 20.635-46 46 0 25.364 20.635 46 46 46s46-20.636 46-46c0-25.365-20.635-46-46-46z"/></svg> How do you need to label your unknown samples? -- <svg aria-hidden="true" role="img" viewBox="0 0 448 512" style="height:1em;width:0.88em;vertical-align:-0.125em;margin-left:auto;margin-right:auto;font-size:inherit;fill:currentColor;overflow:visible;position:relative;"><path d="M400 480H48c-26.51 0-48-21.49-48-48V80c0-26.51 21.49-48 48-48h352c26.51 0 48 21.49 48 48v352c0 26.51-21.49 48-48 48zm-204.686-98.059l184-184c6.248-6.248 6.248-16.379 0-22.627l-22.627-22.627c-6.248-6.248-16.379-6.249-22.628 0L184 302.745l-70.059-70.059c-6.248-6.248-16.379-6.248-22.628 0l-22.627 22.627c-6.248 6.248-6.248 16.379 0 22.627l104 104c6.249 6.25 16.379 6.25 22.628.001z"/></svg> You can use your study codes for each unknown samples --- class: inverse, middle, center # <svg aria-hidden="true" role="img" viewBox="0 0 512 512" style="height:1em;width:1em;vertical-align:-0.125em;margin-left:auto;margin-right:auto;font-size:inherit;fill:currentColor;overflow:visible;position:relative;"><path d="M296 384h-80c-13.3 0-24-10.7-24-24V192h-87.7c-17.8 0-26.7-21.5-14.1-34.1L242.3 5.7c7.5-7.5 19.8-7.5 27.3 0l152.2 152.2c12.6 12.6 3.7 34.1-14.1 34.1H320v168c0 13.3-10.7 24-24 24zm216-8v112c0 13.3-10.7 24-24 24H24c-13.3 0-24-10.7-24-24V376c0-13.3 10.7-24 24-24h136v8c0 30.9 25.1 56 56 56h80c30.9 0 56-25.1 56-56v-8h136c13.3 0 24 10.7 24 24zm-124 88c0-11-9-20-20-20s-20 9-20 20 9 20 20 20 20-9 20-20zm64 0c0-11-9-20-20-20s-20 9-20 20 9 20 20 20 20-9 20-20z"/></svg> ## Importing your data --- # <svg aria-hidden="true" role="img" viewBox="0 0 512 512" style="height:1em;width:1em;vertical-align:-0.125em;margin-left:auto;margin-right:auto;font-size:inherit;fill:currentColor;overflow:visible;position:relative;"><path d="M296 384h-80c-13.3 0-24-10.7-24-24V192h-87.7c-17.8 0-26.7-21.5-14.1-34.1L242.3 5.7c7.5-7.5 19.8-7.5 27.3 0l152.2 152.2c12.6 12.6 3.7 34.1-14.1 34.1H320v168c0 13.3-10.7 24-24 24zm216-8v112c0 13.3-10.7 24-24 24H24c-13.3 0-24-10.7-24-24V376c0-13.3 10.7-24 24-24h136v8c0 30.9 25.1 56 56 56h80c30.9 0 56-25.1 56-56v-8h136c13.3 0 24 10.7 24 24zm-124 88c0-11-9-20-20-20s-20 9-20 20 9 20 20 20 20-9 20-20zm64 0c0-11-9-20-20-20s-20 9-20 20 9 20 20 20 20-9 20-20z"/></svg> Importing your data .panelset.sideways[ .panel[.panel-name[Navigate to the "Import data" tab] 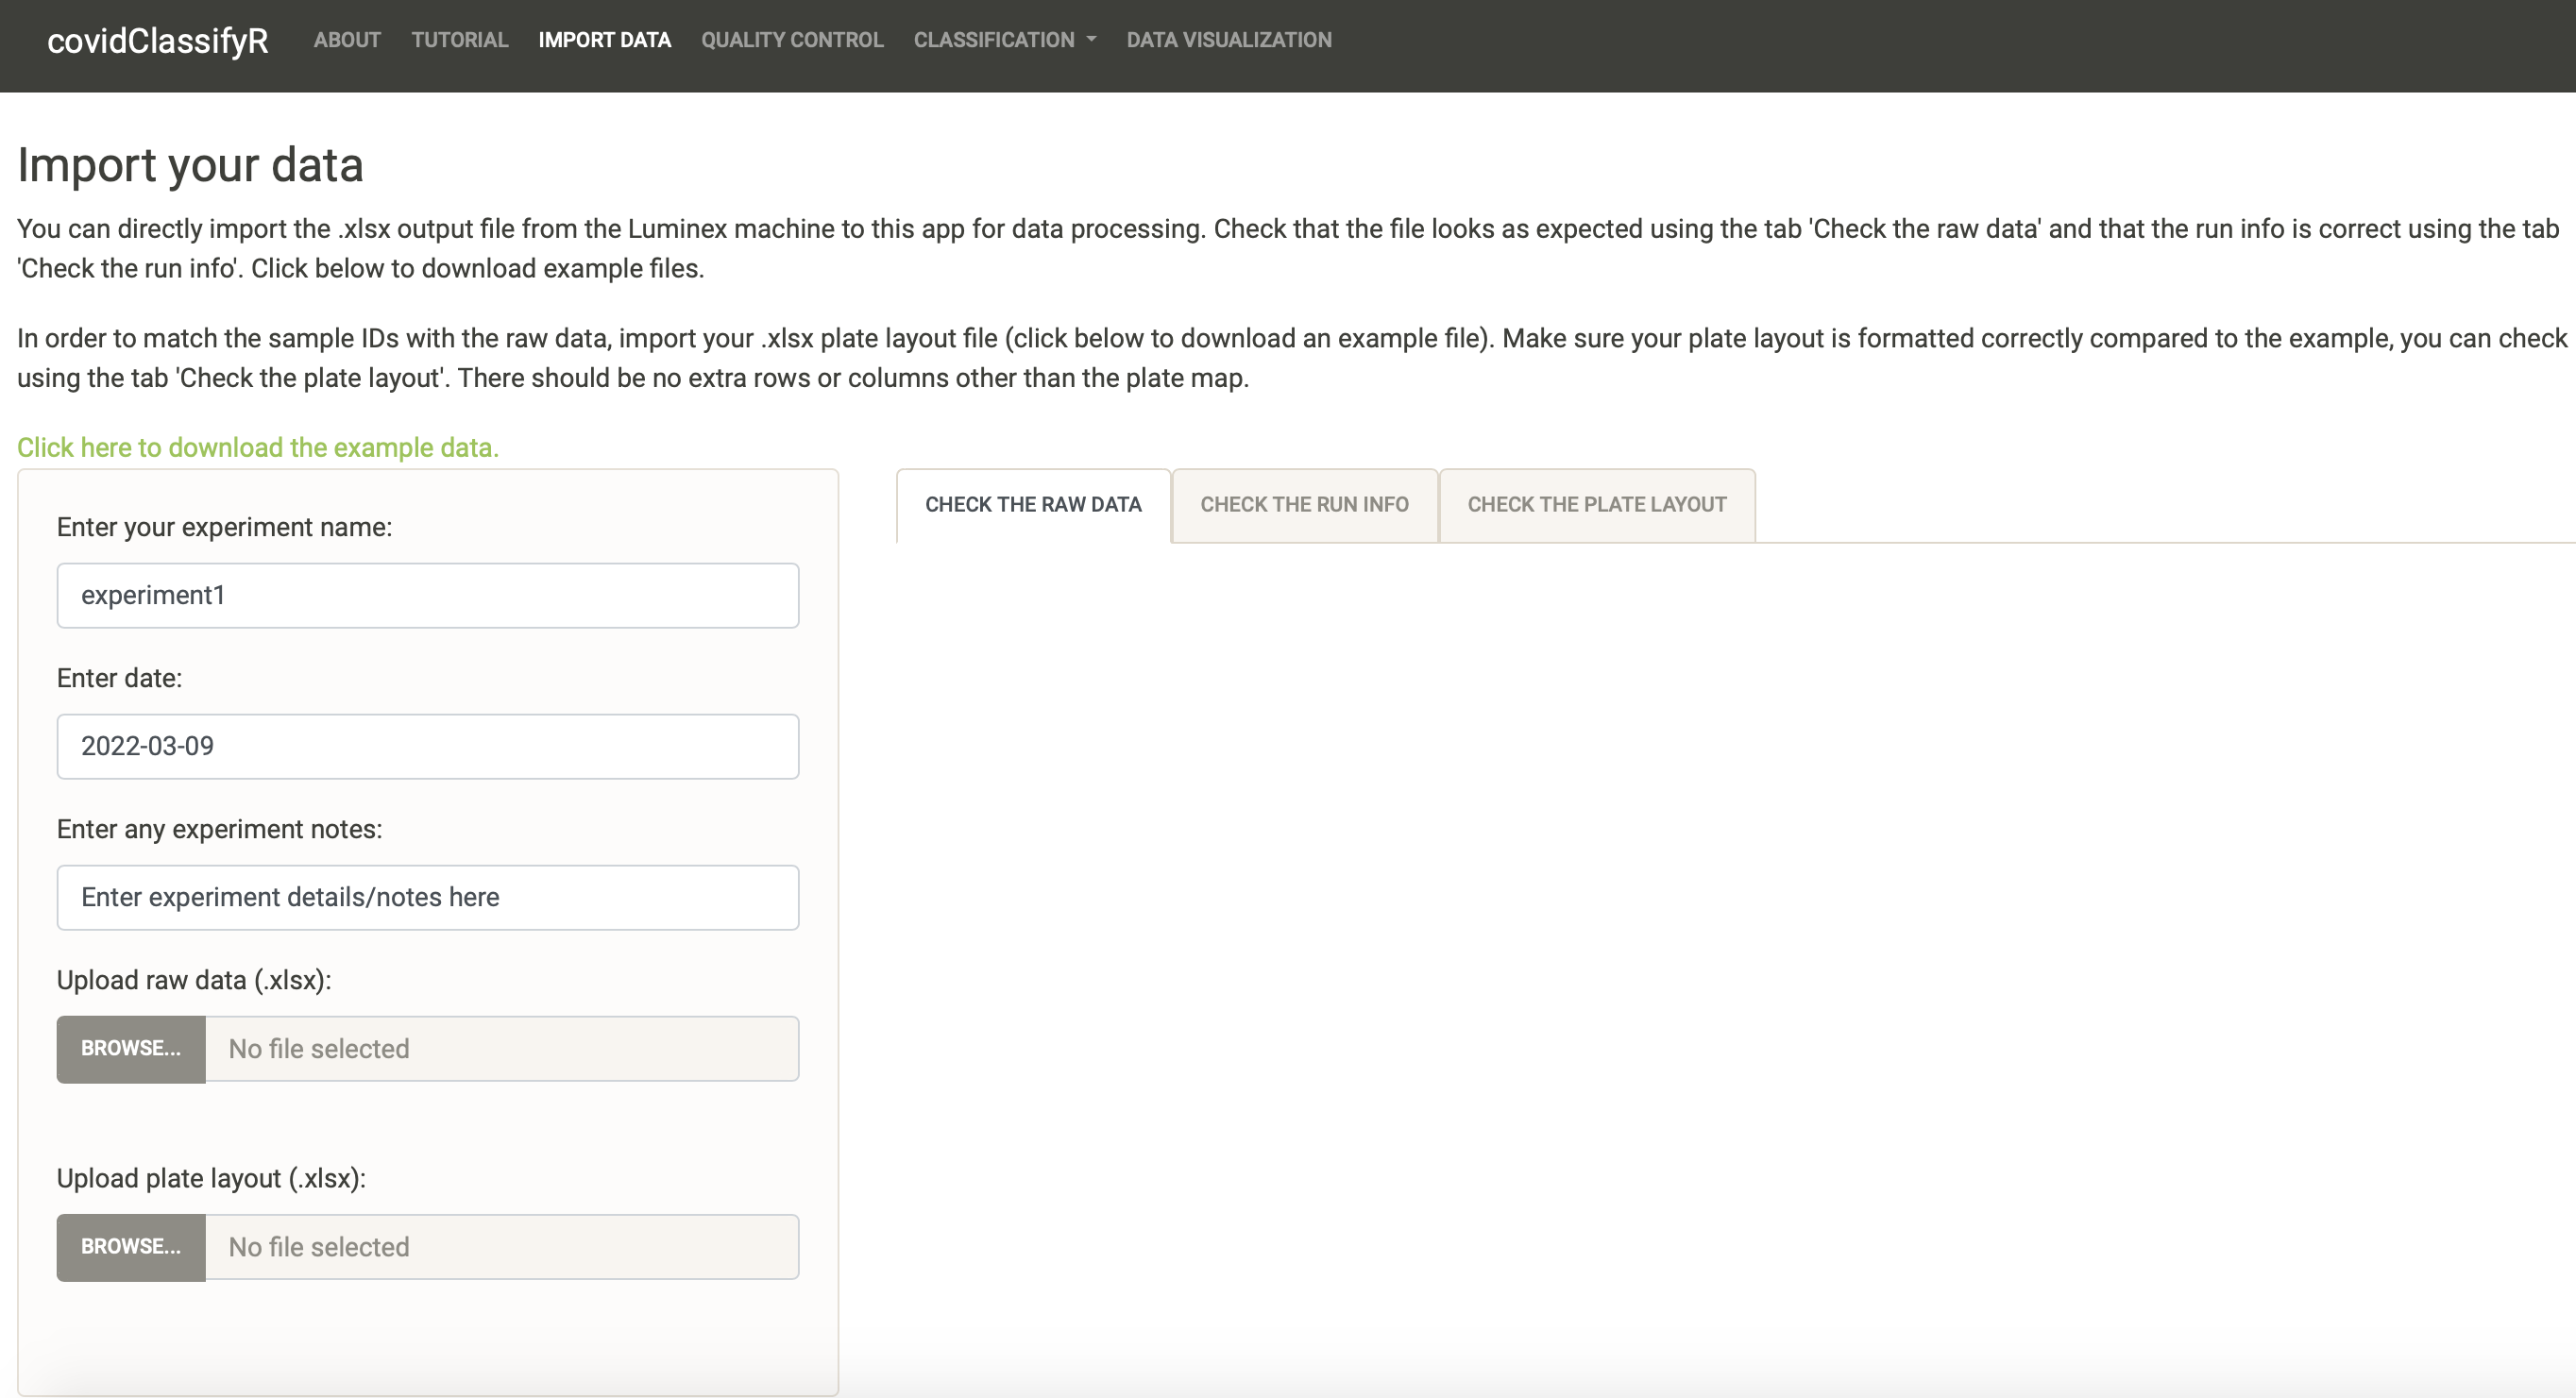 ] .panel[.panel-name[Experiment info] .pull-left[ <img src="img/import_buttons.png" width="350" height="400" /> ] .pull-right[ - Type directly in the text box to change the experiment name that best describes your particular data/Luminex run. For example, you can label it as “MyExperimentName_Plate01”. - The analysis date will default to today’s date, but you can modify this by clicking on the date and selecting the date in the calendar. - You can also insert experiment notes to provide more details or notes, as necessary. These notes will be displayed on your quality control report when you download it. **<svg aria-hidden="true" role="img" viewBox="0 0 352 512" style="height:1em;width:0.69em;vertical-align:-0.125em;margin-left:auto;margin-right:auto;font-size:inherit;fill:currentColor;overflow:visible;position:relative;"><path d="M96.06 454.35c.01 6.29 1.87 12.45 5.36 17.69l17.09 25.69a31.99 31.99 0 0 0 26.64 14.28h61.71a31.99 31.99 0 0 0 26.64-14.28l17.09-25.69a31.989 31.989 0 0 0 5.36-17.69l.04-38.35H96.01l.05 38.35zM0 176c0 44.37 16.45 84.85 43.56 115.78 16.52 18.85 42.36 58.23 52.21 91.45.04.26.07.52.11.78h160.24c.04-.26.07-.51.11-.78 9.85-33.22 35.69-72.6 52.21-91.45C335.55 260.85 352 220.37 352 176 352 78.61 272.91-.3 175.45 0 73.44.31 0 82.97 0 176zm176-80c-44.11 0-80 35.89-80 80 0 8.84-7.16 16-16 16s-16-7.16-16-16c0-61.76 50.24-112 112-112 8.84 0 16 7.16 16 16s-7.16 16-16 16z"/></svg> Tip: ** Try to keep your experiment name/filename free of spaces and instead use “_” or “-”. All of your downloadable files (processed data, quality control report, etc) will be labeled as “experiment1_2022-03-06”. ] ] .panel[.panel-name[Change the experiment info] <video width="1330" height="410" controls> <source src="screen_records/edit_import.mp4" type="video/mp4"> </video> ] .panel[.panel-name[Upload your files] .pull-left[ <img src="img/import_uploaded_data.png" width="350" height="400" /> ] .pull-right[ Use the browse button to navigate to your files and upload them. **<svg aria-hidden="true" role="img" viewBox="0 0 352 512" style="height:1em;width:0.69em;vertical-align:-0.125em;margin-left:auto;margin-right:auto;font-size:inherit;fill:currentColor;overflow:visible;position:relative;"><path d="M96.06 454.35c.01 6.29 1.87 12.45 5.36 17.69l17.09 25.69a31.99 31.99 0 0 0 26.64 14.28h61.71a31.99 31.99 0 0 0 26.64-14.28l17.09-25.69a31.989 31.989 0 0 0 5.36-17.69l.04-38.35H96.01l.05 38.35zM0 176c0 44.37 16.45 84.85 43.56 115.78 16.52 18.85 42.36 58.23 52.21 91.45.04.26.07.52.11.78h160.24c.04-.26.07-.51.11-.78 9.85-33.22 35.69-72.6 52.21-91.45C335.55 260.85 352 220.37 352 176 352 78.61 272.91-.3 175.45 0 73.44.31 0 82.97 0 176zm176-80c-44.11 0-80 35.89-80 80 0 8.84-7.16 16-16 16s-16-7.16-16-16c0-61.76 50.24-112 112-112 8.84 0 16 7.16 16 16s-7.16 16-16 16z"/></svg> Tip: ** The bar should look blue when the upload is successful. If you get an error, make sure you are uploading .xlsx files. ]] ] --- # <svg aria-hidden="true" role="img" viewBox="0 0 512 512" style="height:1em;width:1em;vertical-align:-0.125em;margin-left:auto;margin-right:auto;font-size:inherit;fill:currentColor;overflow:visible;position:relative;"><path d="M224 96l16-32 32-16-32-16-16-32-16 32-32 16 32 16 16 32zM80 160l26.66-53.33L160 80l-53.34-26.67L80 0 53.34 53.33 0 80l53.34 26.67L80 160zm352 128l-26.66 53.33L352 368l53.34 26.67L432 448l26.66-53.33L512 368l-53.34-26.67L432 288zm70.62-193.77L417.77 9.38C411.53 3.12 403.34 0 395.15 0c-8.19 0-16.38 3.12-22.63 9.38L9.38 372.52c-12.5 12.5-12.5 32.76 0 45.25l84.85 84.85c6.25 6.25 14.44 9.37 22.62 9.37 8.19 0 16.38-3.12 22.63-9.37l363.14-363.15c12.5-12.48 12.5-32.75 0-45.24zM359.45 203.46l-50.91-50.91 86.6-86.6 50.91 50.91-86.6 86.6z"/></svg> Voila! <video width="1330" height="410" controls> <source src="screen_records/upload_files.mp4" type="video/mp4"> </video> --- # Check the raw data .pull-left[ ### You will notice that the “Check the raw data” tab has populated with a preview of your raw data file. <svg aria-hidden="true" role="img" viewBox="0 0 448 512" style="height:1em;width:0.88em;vertical-align:-0.125em;margin-left:auto;margin-right:auto;font-size:inherit;fill:currentColor;overflow:visible;position:relative;"><path d="M400 480H48c-26.51 0-48-21.49-48-48V80c0-26.51 21.49-48 48-48h352c26.51 0 48 21.49 48 48v352c0 26.51-21.49 48-48 48zm-204.686-98.059l184-184c6.248-6.248 6.248-16.379 0-22.627l-22.627-22.627c-6.248-6.248-16.379-6.249-22.628 0L184 302.745l-70.059-70.059c-6.248-6.248-16.379-6.248-22.628 0l-22.627 22.627c-6.248 6.248-6.248 16.379 0 22.627l104 104c6.249 6.25 16.379 6.25 22.628.001z"/></svg> Check whether it looks as expected. You can scroll as needed. <svg aria-hidden="true" role="img" viewBox="0 0 448 512" style="height:1em;width:0.88em;vertical-align:-0.125em;margin-left:auto;margin-right:auto;font-size:inherit;fill:currentColor;overflow:visible;position:relative;"><path d="M400 480H48c-26.51 0-48-21.49-48-48V80c0-26.51 21.49-48 48-48h352c26.51 0 48 21.49 48 48v352c0 26.51-21.49 48-48 48zm-204.686-98.059l184-184c6.248-6.248 6.248-16.379 0-22.627l-22.627-22.627c-6.248-6.248-16.379-6.249-22.628 0L184 302.745l-70.059-70.059c-6.248-6.248-16.379-6.248-22.628 0l-22.627 22.627c-6.248 6.248-6.248 16.379 0 22.627l104 104c6.249 6.25 16.379 6.25 22.628.001z"/></svg> Check that the raw data file you uploaded was the correct one, by looking at the “Raw data filename” directly under the tab. If it is the wrong one you can click on “Browse” again and upload the correct file. ] .pull-right[ 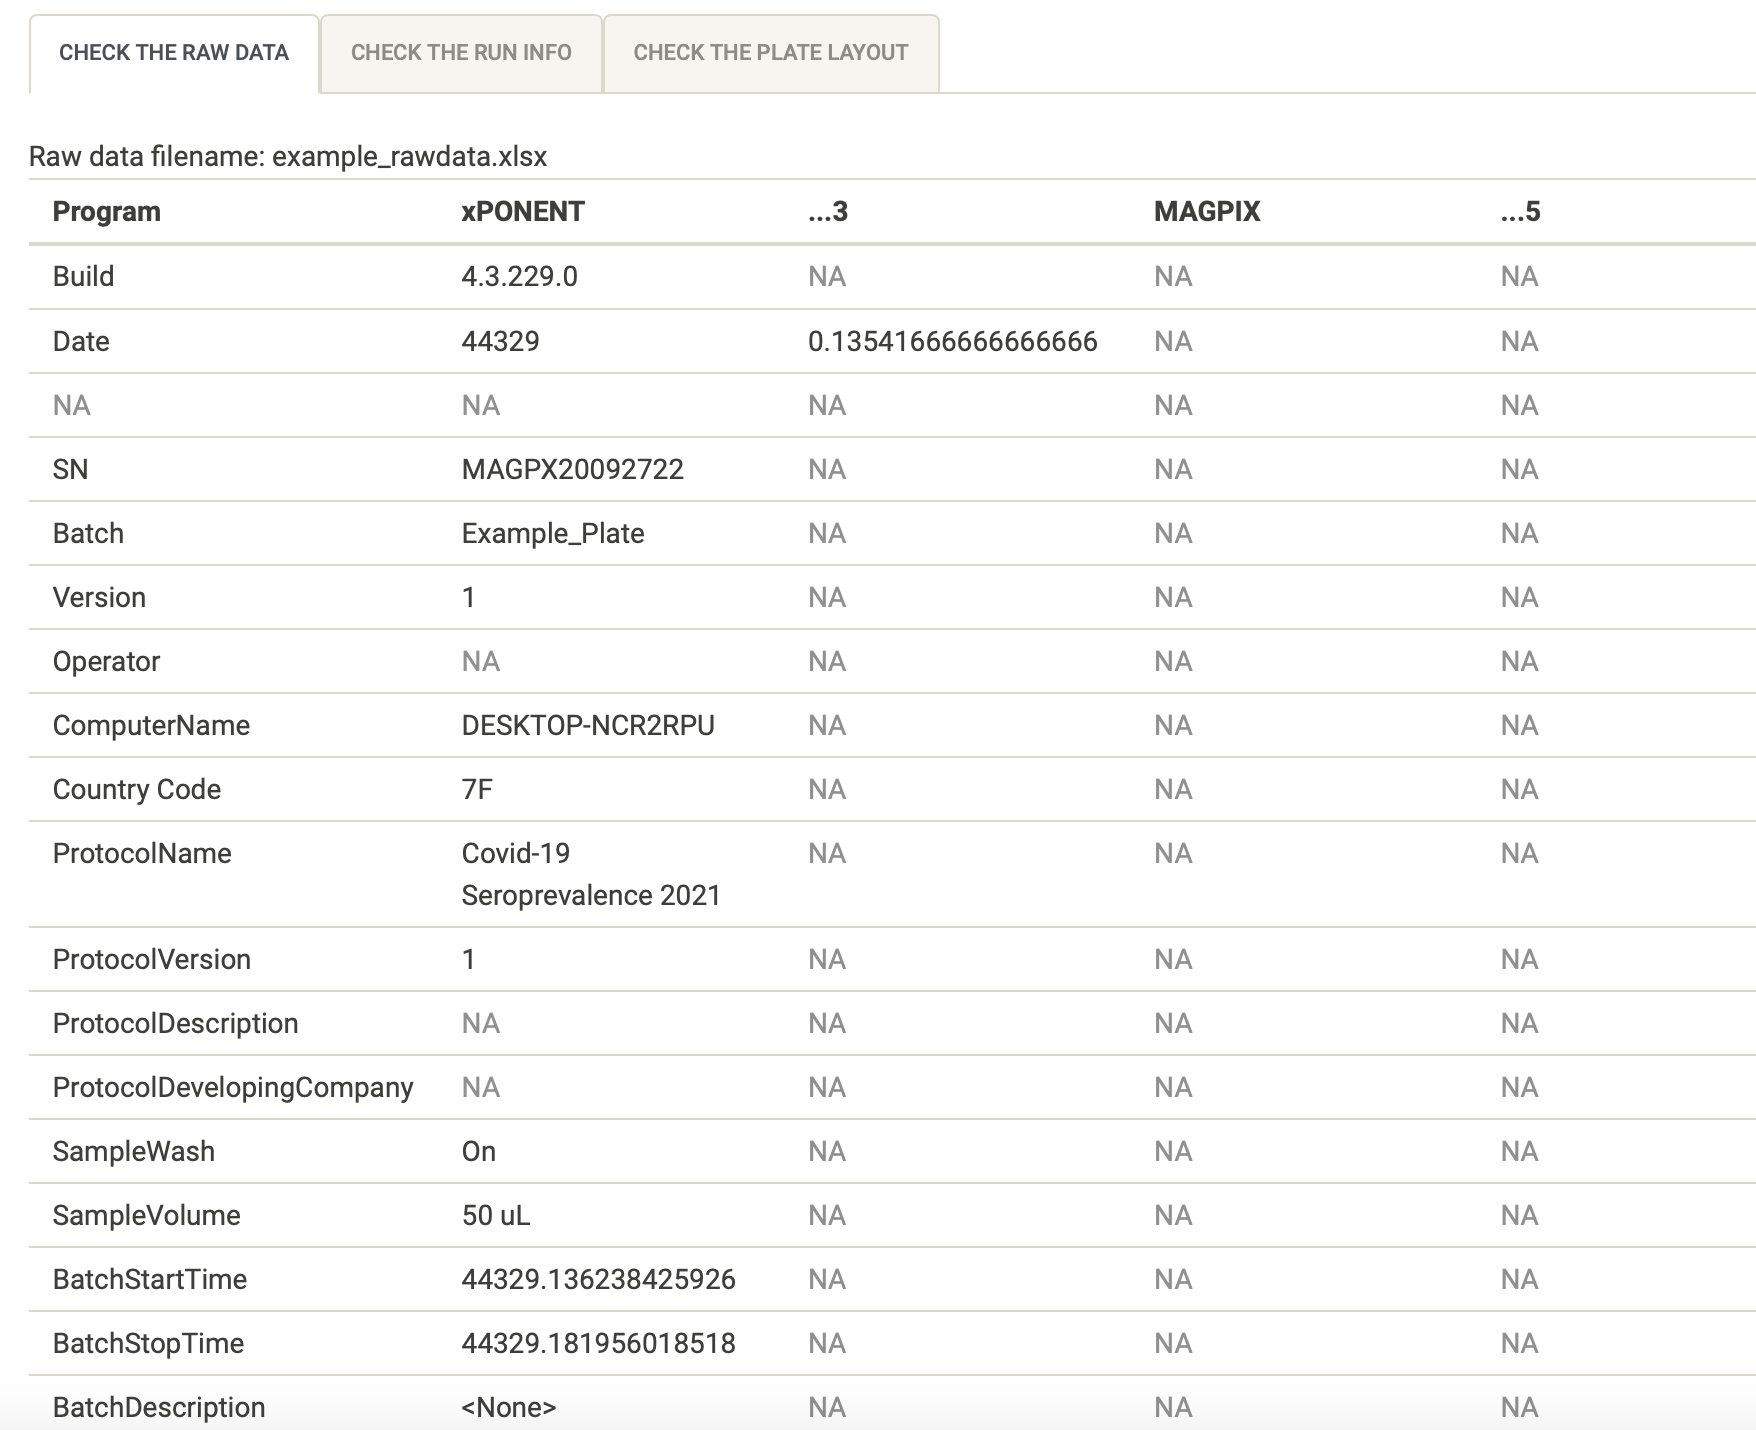 ] --- # Check the run info .pull-left[ ### You can use the “Check the run info” tab to only look at run specifications and check that they are expected. <svg aria-hidden="true" role="img" viewBox="0 0 448 512" style="height:1em;width:0.88em;vertical-align:-0.125em;margin-left:auto;margin-right:auto;font-size:inherit;fill:currentColor;overflow:visible;position:relative;"><path d="M400 480H48c-26.51 0-48-21.49-48-48V80c0-26.51 21.49-48 48-48h352c26.51 0 48 21.49 48 48v352c0 26.51-21.49 48-48 48zm-204.686-98.059l184-184c6.248-6.248 6.248-16.379 0-22.627l-22.627-22.627c-6.248-6.248-16.379-6.249-22.628 0L184 302.745l-70.059-70.059c-6.248-6.248-16.379-6.248-22.628 0l-22.627 22.627c-6.248 6.248-6.248 16.379 0 22.627l104 104c6.249 6.25 16.379 6.25 22.628.001z"/></svg> Check that the Batch, ProtocolName and sample volume are correct and labeled as you expect them to be ] .pull-right[ 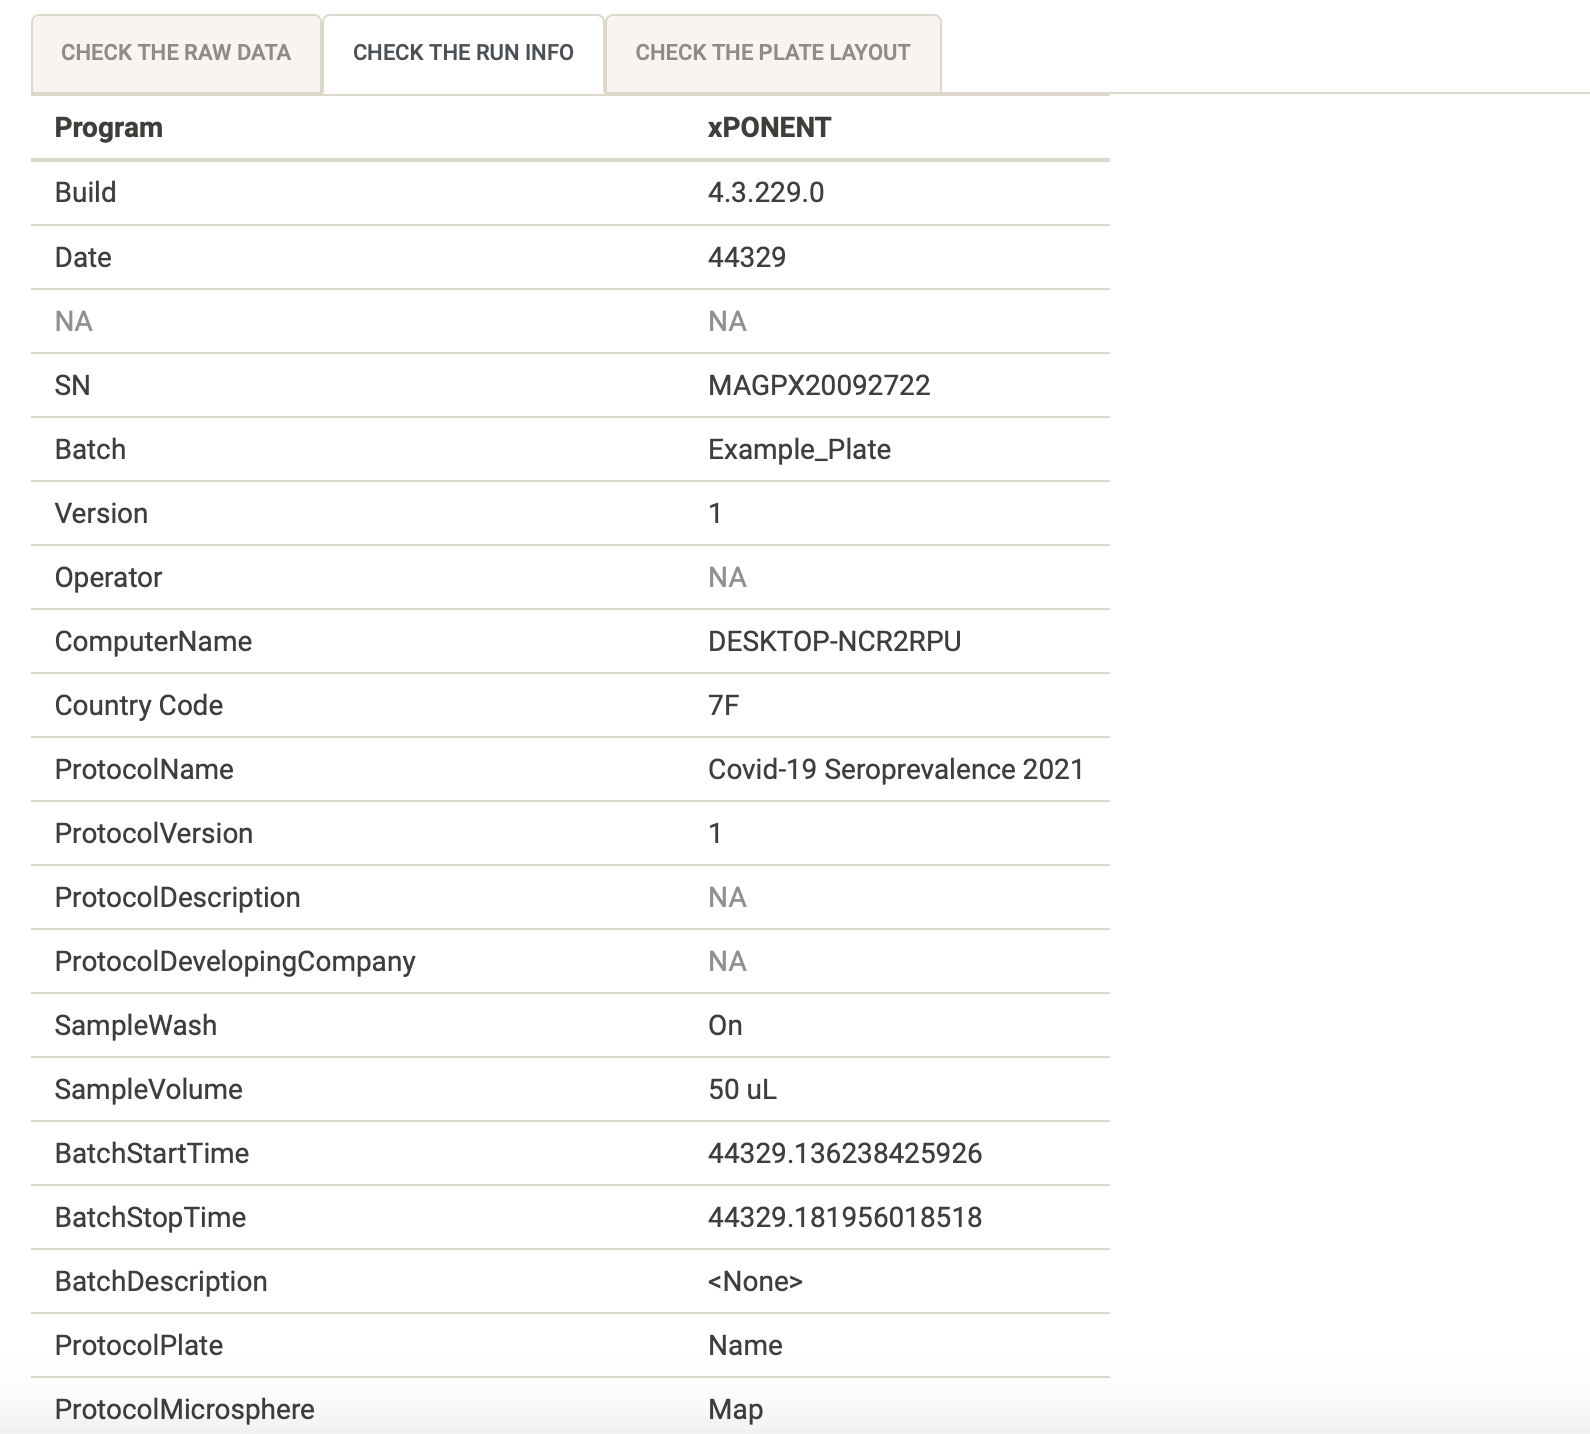 ] --- # Check the plate layout .pull-left[ You can use the “Check the plate layout” tab to make sure the plate layout looks as expected. It is very important to make sure your samples are labeled correctly so that they are interpreted correctly by the app. <svg aria-hidden="true" role="img" viewBox="0 0 448 512" style="height:1em;width:0.88em;vertical-align:-0.125em;margin-left:auto;margin-right:auto;font-size:inherit;fill:currentColor;overflow:visible;position:relative;"><path d="M400 480H48c-26.51 0-48-21.49-48-48V80c0-26.51 21.49-48 48-48h352c26.51 0 48 21.49 48 48v352c0 26.51-21.49 48-48 48zm-204.686-98.059l184-184c6.248-6.248 6.248-16.379 0-22.627l-22.627-22.627c-6.248-6.248-16.379-6.249-22.628 0L184 302.745l-70.059-70.059c-6.248-6.248-16.379-6.248-22.628 0l-22.627 22.627c-6.248 6.248-6.248 16.379 0 22.627l104 104c6.249 6.25 16.379 6.25 22.628.001z"/></svg> Check that the plate layout file you uploaded was the correct one, by looking at the “Plate layout filename” directly under the tab. If it is the wrong one you can click on “Browse” again and upload the correct file. <svg aria-hidden="true" role="img" viewBox="0 0 448 512" style="height:1em;width:0.88em;vertical-align:-0.125em;margin-left:auto;margin-right:auto;font-size:inherit;fill:currentColor;overflow:visible;position:relative;"><path d="M400 480H48c-26.51 0-48-21.49-48-48V80c0-26.51 21.49-48 48-48h352c26.51 0 48 21.49 48 48v352c0 26.51-21.49 48-48 48zm-204.686-98.059l184-184c6.248-6.248 6.248-16.379 0-22.627l-22.627-22.627c-6.248-6.248-16.379-6.249-22.628 0L184 302.745l-70.059-70.059c-6.248-6.248-16.379-6.248-22.628 0l-22.627 22.627c-6.248 6.248-6.248 16.379 0 22.627l104 104c6.249 6.25 16.379 6.25 22.628.001z"/></svg> Make sure that there are no extra cells filled out other than the plate wells and sample names. ] .pull-right[ 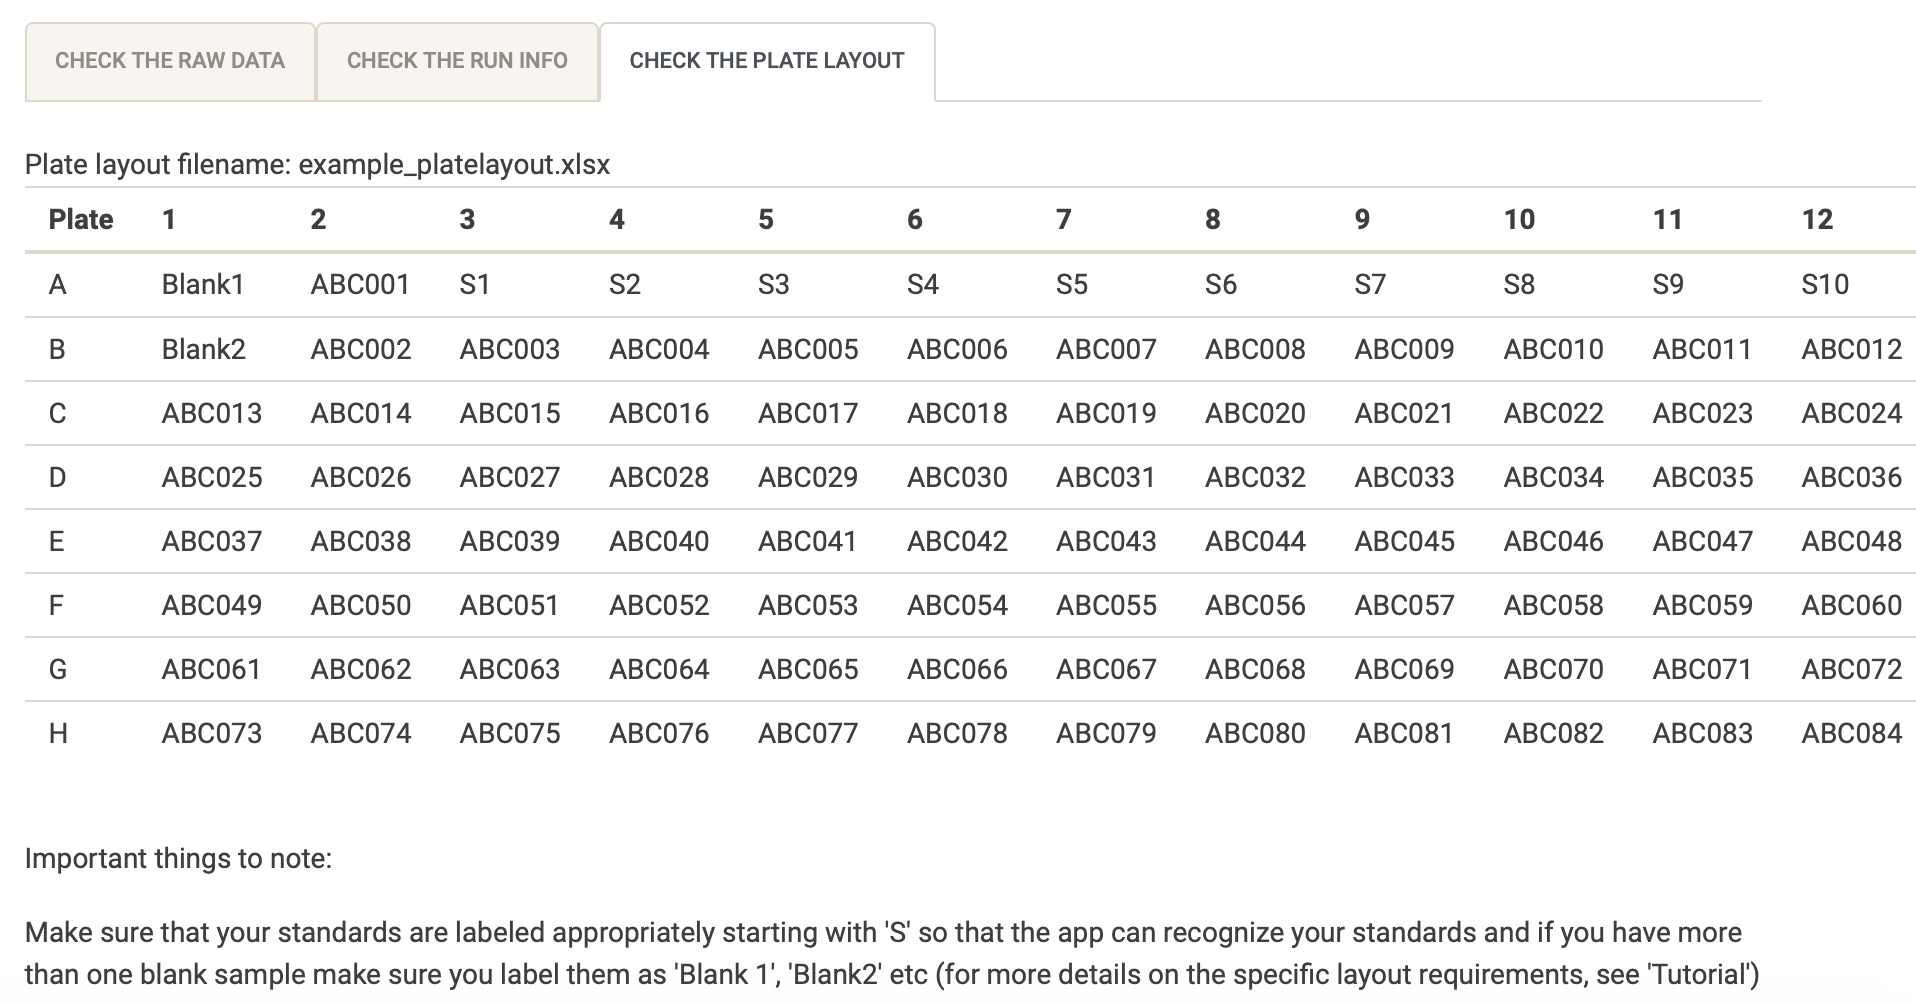 ] --- # <svg aria-hidden="true" role="img" viewBox="0 0 640 512" style="height:1em;width:1.25em;vertical-align:-0.125em;margin-left:auto;margin-right:auto;font-size:inherit;fill:currentColor;overflow:visible;position:relative;"><path d="M255.03 261.65c6.25 6.25 16.38 6.25 22.63 0l11.31-11.31c6.25-6.25 6.25-16.38 0-22.63L253.25 192l35.71-35.72c6.25-6.25 6.25-16.38 0-22.63l-11.31-11.31c-6.25-6.25-16.38-6.25-22.63 0l-58.34 58.34c-6.25 6.25-6.25 16.38 0 22.63l58.35 58.34zm96.01-11.3l11.31 11.31c6.25 6.25 16.38 6.25 22.63 0l58.34-58.34c6.25-6.25 6.25-16.38 0-22.63l-58.34-58.34c-6.25-6.25-16.38-6.25-22.63 0l-11.31 11.31c-6.25 6.25-6.25 16.38 0 22.63L386.75 192l-35.71 35.72c-6.25 6.25-6.25 16.38 0 22.63zM624 416H381.54c-.74 19.81-14.71 32-32.74 32H288c-18.69 0-33.02-17.47-32.77-32H16c-8.8 0-16 7.2-16 16v16c0 35.2 28.8 64 64 64h512c35.2 0 64-28.8 64-64v-16c0-8.8-7.2-16-16-16zM576 48c0-26.4-21.6-48-48-48H112C85.6 0 64 21.6 64 48v336h512V48zm-64 272H128V64h384v256z"/></svg> Demo <video width="1330" height="410" controls> <source src="screen_records/import_data_demo.mp4" type="video/mp4"> </video> --- class: inverse, middle, center # <svg aria-hidden="true" role="img" viewBox="0 0 384 512" style="height:1em;width:0.75em;vertical-align:-0.125em;margin-left:auto;margin-right:auto;font-size:inherit;fill:currentColor;overflow:visible;position:relative;"><path d="M336 64h-80c0-35.3-28.7-64-64-64s-64 28.7-64 64H48C21.5 64 0 85.5 0 112v352c0 26.5 21.5 48 48 48h288c26.5 0 48-21.5 48-48V112c0-26.5-21.5-48-48-48zM192 40c13.3 0 24 10.7 24 24s-10.7 24-24 24-24-10.7-24-24 10.7-24 24-24zm121.2 231.8l-143 141.8c-4.7 4.7-12.3 4.6-17-.1l-82.6-83.3c-4.7-4.7-4.6-12.3.1-17L99.1 285c4.7-4.7 12.3-4.6 17 .1l46 46.4 106-105.2c4.7-4.7 12.3-4.6 17 .1l28.2 28.4c4.7 4.8 4.6 12.3-.1 17z"/></svg> ## Next session: ### Quality control of your data --- # Acknowledgments - Dr Maria Ome-Kaius and Dr Fiona Angrisano - PNGIMR and partner institutions - WEHI & Burnet Institute - All of you for attending! *We are extremely grateful for financial support to develop and host the covidClassifyR Shiny web application, and to host these virtual workshops through the [Regional Collaborations Programme COVID-19 Digital Grant](https://www.science.org.au/news-and-events/news-and-media-releases/regional-research-set-get-digital-boost) from the Australian Academy of Science and Australian Department of Industry, Science, Energy and Resources.* The scripts and functions used in [`covidClassifyR`](https://shaziaruybal.shinyapps.io/covidclassifyr) were developed by Shazia Ruybal-Pesántez, with contributions from the following researchers: Eamon Conway, Connie Li Wan Suen, Narimane Nekkab and Michael White. .footnote[ _These slides were created using the R packages: [xaringan](https://github.com/yihui/xaringan), [xaringanthemer](https://github.com/gadenbuie/xaringanthemer), [xaringanExtra](https://github.com/gadenbuie/xaringanExtra)_ ] --- name: contact class: inverse .pull-left[ .center[ ### Dr Shazia Ruybal-Pesántez <img style="border-radius: 50%;" src="https://shaziaruybal.github.io/covidClassifyR-workshop/images/shazia.png" width="250px"/> #### Contact details [<svg aria-hidden="true" role="img" viewBox="0 0 512 512" style="height:1em;width:1em;vertical-align:-0.125em;margin-left:auto;margin-right:auto;font-size:inherit;fill:currentColor;overflow:visible;position:relative;"><path d="M502.3 190.8c3.9-3.1 9.7-.2 9.7 4.7V400c0 26.5-21.5 48-48 48H48c-26.5 0-48-21.5-48-48V195.6c0-5 5.7-7.8 9.7-4.7 22.4 17.4 52.1 39.5 154.1 113.6 21.1 15.4 56.7 47.8 92.2 47.6 35.7.3 72-32.8 92.3-47.6 102-74.1 131.6-96.3 154-113.7zM256 320c23.2.4 56.6-29.2 73.4-41.4 132.7-96.3 142.8-104.7 173.4-128.7 5.8-4.5 9.2-11.5 9.2-18.9v-19c0-26.5-21.5-48-48-48H48C21.5 64 0 85.5 0 112v19c0 7.4 3.4 14.3 9.2 18.9 30.6 23.9 40.7 32.4 173.4 128.7 16.8 12.2 50.2 41.8 73.4 41.4z"/></svg> ruybal.s@wehi.edu.au](mailto:ruybal.s@wehi.edu.au) [<svg aria-hidden="true" role="img" viewBox="0 0 512 512" style="height:1em;width:1em;vertical-align:-0.125em;margin-left:auto;margin-right:auto;font-size:inherit;fill:currentColor;overflow:visible;position:relative;"><path d="M459.37 151.716c.325 4.548.325 9.097.325 13.645 0 138.72-105.583 298.558-298.558 298.558-59.452 0-114.68-17.219-161.137-47.106 8.447.974 16.568 1.299 25.34 1.299 49.055 0 94.213-16.568 130.274-44.832-46.132-.975-84.792-31.188-98.112-72.772 6.498.974 12.995 1.624 19.818 1.624 9.421 0 18.843-1.3 27.614-3.573-48.081-9.747-84.143-51.98-84.143-102.985v-1.299c13.969 7.797 30.214 12.67 47.431 13.319-28.264-18.843-46.781-51.005-46.781-87.391 0-19.492 5.197-37.36 14.294-52.954 51.655 63.675 129.3 105.258 216.365 109.807-1.624-7.797-2.599-15.918-2.599-24.04 0-57.828 46.782-104.934 104.934-104.934 30.213 0 57.502 12.67 76.67 33.137 23.715-4.548 46.456-13.32 66.599-25.34-7.798 24.366-24.366 44.833-46.132 57.827 21.117-2.273 41.584-8.122 60.426-16.243-14.292 20.791-32.161 39.308-52.628 54.253z"/></svg> @DrShaziaRuybal](https://twitter.com/DrShaziaRuybal) ]] .pull-right[ ### Session 4 Resources: ### [<i class="fab fa-youtube "></i> Recording](https://youtu.be/G4etCejNviA) ### [<i class="fas fa-laptop-code "></i> `covidClassifyR`](https://shaziaruybal.shinyapps.io/covidClassifyR) ### [<svg aria-hidden="true" role="img" viewBox="0 0 496 512" style="height:1em;width:0.97em;vertical-align:-0.125em;margin-left:auto;margin-right:auto;font-size:inherit;fill:currentColor;overflow:visible;position:relative;"><path d="M336.5 160C322 70.7 287.8 8 248 8s-74 62.7-88.5 152h177zM152 256c0 22.2 1.2 43.5 3.3 64h185.3c2.1-20.5 3.3-41.8 3.3-64s-1.2-43.5-3.3-64H155.3c-2.1 20.5-3.3 41.8-3.3 64zm324.7-96c-28.6-67.9-86.5-120.4-158-141.6 24.4 33.8 41.2 84.7 50 141.6h108zM177.2 18.4C105.8 39.6 47.8 92.1 19.3 160h108c8.7-56.9 25.5-107.8 49.9-141.6zM487.4 192H372.7c2.1 21 3.3 42.5 3.3 64s-1.2 43-3.3 64h114.6c5.5-20.5 8.6-41.8 8.6-64s-3.1-43.5-8.5-64zM120 256c0-21.5 1.2-43 3.3-64H8.6C3.2 212.5 0 233.8 0 256s3.2 43.5 8.6 64h114.6c-2-21-3.2-42.5-3.2-64zm39.5 96c14.5 89.3 48.7 152 88.5 152s74-62.7 88.5-152h-177zm159.3 141.6c71.4-21.2 129.4-73.7 158-141.6h-108c-8.8 56.9-25.6 107.8-50 141.6zM19.3 352c28.6 67.9 86.5 120.4 158 141.6-24.4-33.8-41.2-84.7-50-141.6h-108z"/></svg> Workshop materials](https://shaziaruybal.github.io/covidClassifyR-workshop/materials.html) ### [<svg aria-hidden="true" role="img" viewBox="0 0 512 512" style="height:1em;width:1em;vertical-align:-0.125em;margin-left:auto;margin-right:auto;font-size:inherit;fill:currentColor;overflow:visible;position:relative;"><path d="M464 448H48c-26.51 0-48-21.49-48-48V112c0-26.51 21.49-48 48-48h416c26.51 0 48 21.49 48 48v288c0 26.51-21.49 48-48 48zM112 120c-30.928 0-56 25.072-56 56s25.072 56 56 56 56-25.072 56-56-25.072-56-56-56zM64 384h384V272l-87.515-87.515c-4.686-4.686-12.284-4.686-16.971 0L208 320l-55.515-55.515c-4.686-4.686-12.284-4.686-16.971 0L64 336v48z"/></svg> Slides for Session 4](https://shaziaruybal.github.io/covidClassifyR-workshop/slides/session4/session4_slides.html) ] --- class: inverse, middle, center # <svg aria-hidden="true" role="img" viewBox="0 0 512 512" style="height:1em;width:1em;vertical-align:-0.125em;margin-left:auto;margin-right:auto;font-size:inherit;fill:currentColor;overflow:visible;position:relative;"><path d="M504 256c0 136.997-111.043 248-248 248S8 392.997 8 256C8 119.083 119.043 8 256 8s248 111.083 248 248zM262.655 90c-54.497 0-89.255 22.957-116.549 63.758-3.536 5.286-2.353 12.415 2.715 16.258l34.699 26.31c5.205 3.947 12.621 3.008 16.665-2.122 17.864-22.658 30.113-35.797 57.303-35.797 20.429 0 45.698 13.148 45.698 32.958 0 14.976-12.363 22.667-32.534 33.976C247.128 238.528 216 254.941 216 296v4c0 6.627 5.373 12 12 12h56c6.627 0 12-5.373 12-12v-1.333c0-28.462 83.186-29.647 83.186-106.667 0-58.002-60.165-102-116.531-102zM256 338c-25.365 0-46 20.635-46 46 0 25.364 20.635 46 46 46s46-20.636 46-46c0-25.365-20.635-46-46-46z"/></svg> Questions?