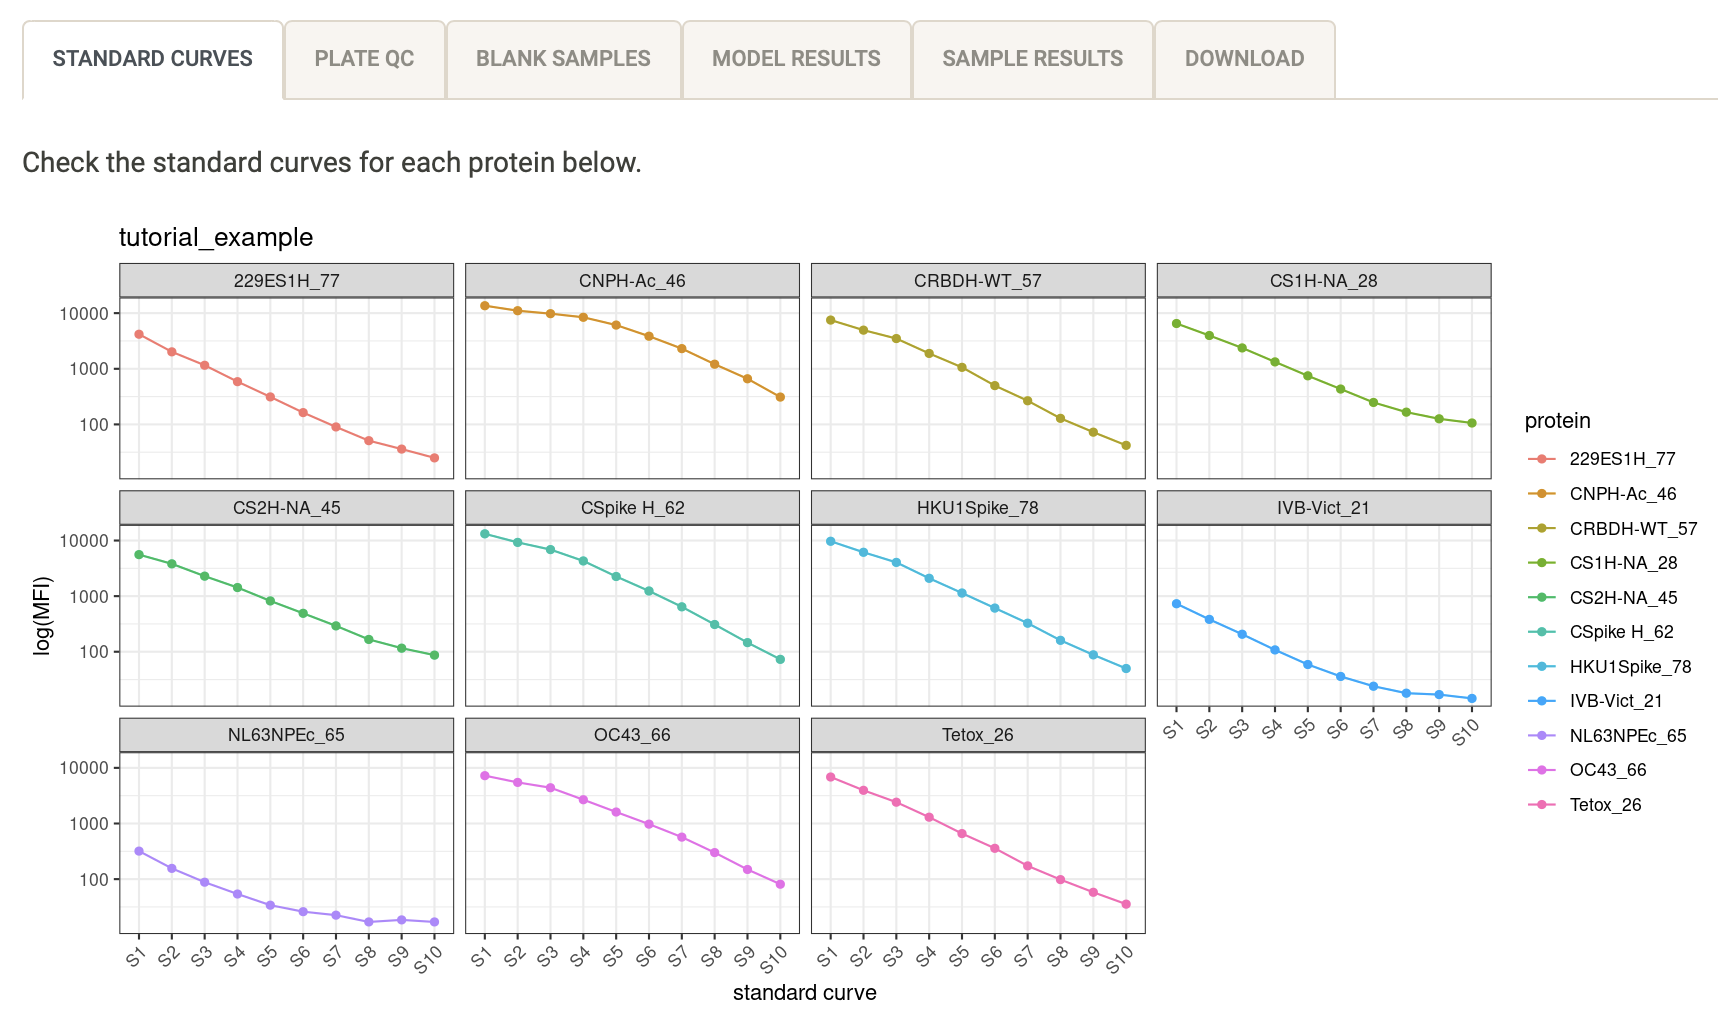
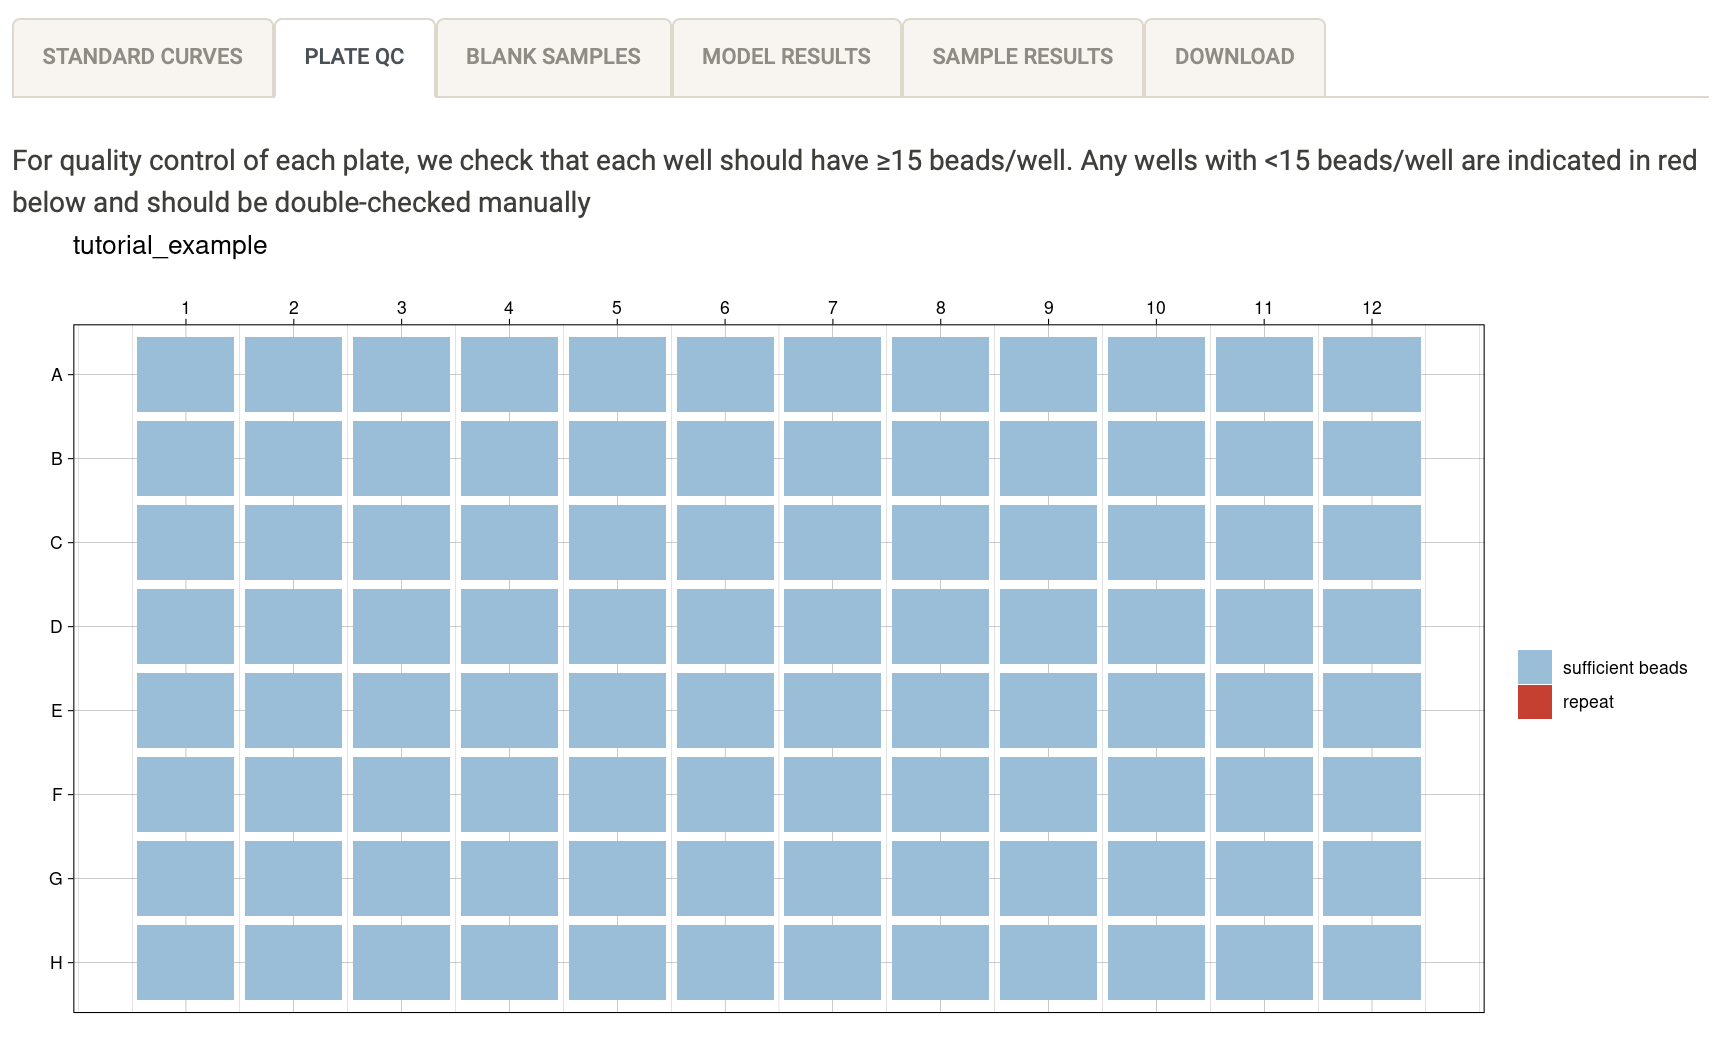
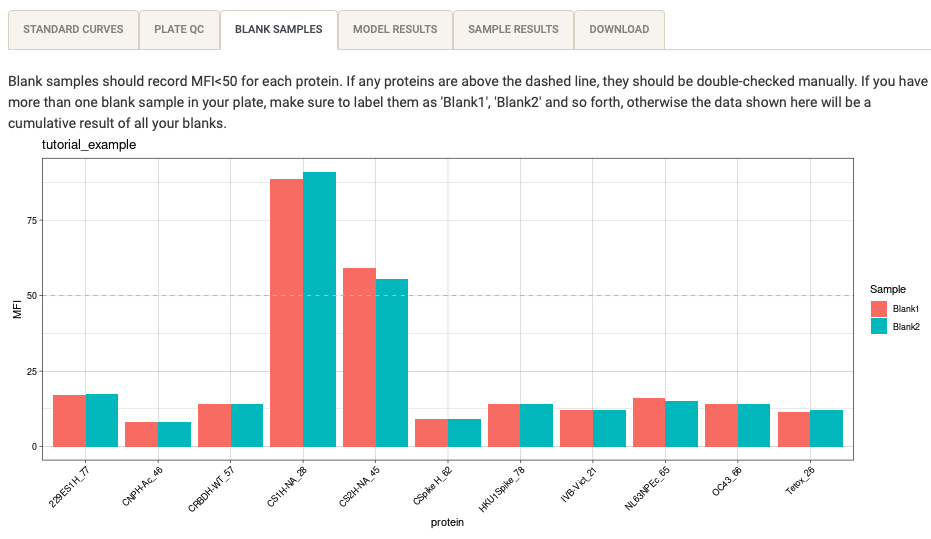
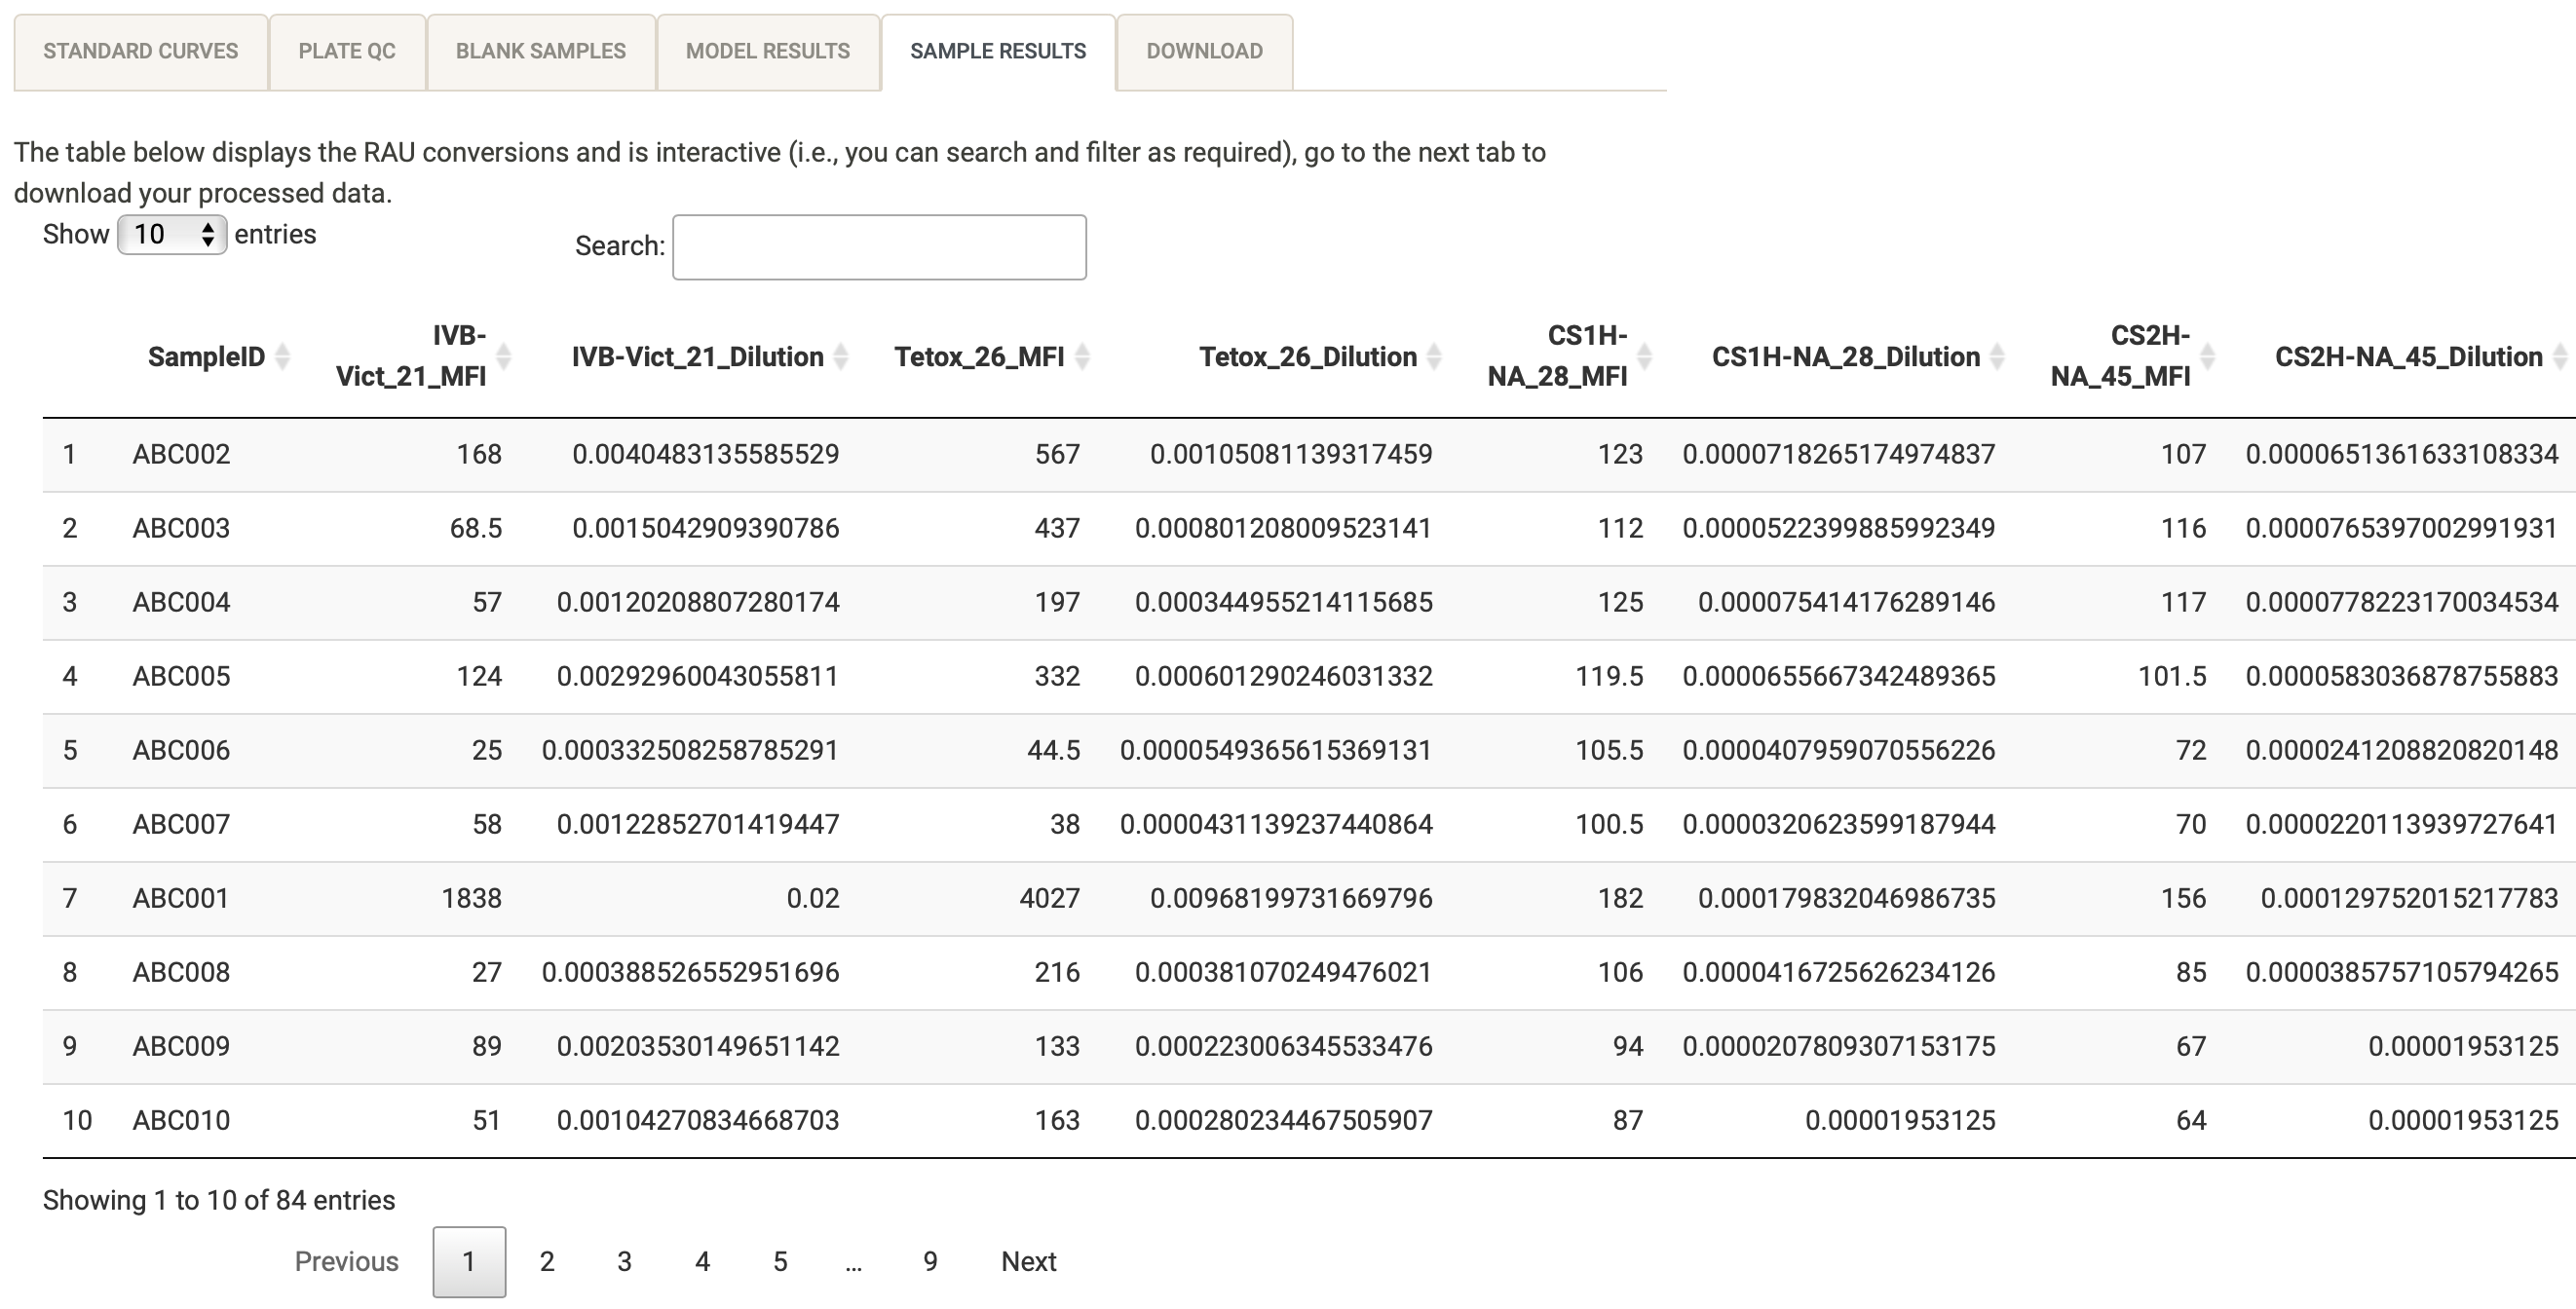
class: title-slide, middle, left ## Session 5: How to perform quality control of your data ### Dr Shazia Ruybal-Pesántez Presented at the [covidClassifyR Shiny app workshop](https://shaziaruybal.github.io/covidClassifyR-workshop) for researchers from PNGIMR and partner institutions 2022-03-11 --- class: left # Recap -- #### <svg aria-hidden="true" role="img" viewBox="0 0 448 512" style="height:1em;width:0.88em;vertical-align:-0.125em;margin-left:auto;margin-right:auto;font-size:inherit;fill:currentColor;overflow:visible;position:relative;"><path d="M400 480H48c-26.51 0-48-21.49-48-48V80c0-26.51 21.49-48 48-48h352c26.51 0 48 21.49 48 48v352c0 26.51-21.49 48-48 48zm-204.686-98.059l184-184c6.248-6.248 6.248-16.379 0-22.627l-22.627-22.627c-6.248-6.248-16.379-6.249-22.628 0L184 302.745l-70.059-70.059c-6.248-6.248-16.379-6.248-22.628 0l-22.627 22.627c-6.248 6.248-6.248 16.379 0 22.627l104 104c6.249 6.25 16.379 6.25 22.628.001z"/></svg> **[Session 1](https://shaziaruybal.github.io/covidClassifyR-workshop/sessions/2022-03-10-session1/index.html)** gave you an overview of the Luminex technology and the COVID-19 multi-antigen serological assay that was established in PNG -- #### <svg aria-hidden="true" role="img" viewBox="0 0 448 512" style="height:1em;width:0.88em;vertical-align:-0.125em;margin-left:auto;margin-right:auto;font-size:inherit;fill:currentColor;overflow:visible;position:relative;"><path d="M400 480H48c-26.51 0-48-21.49-48-48V80c0-26.51 21.49-48 48-48h352c26.51 0 48 21.49 48 48v352c0 26.51-21.49 48-48 48zm-204.686-98.059l184-184c6.248-6.248 6.248-16.379 0-22.627l-22.627-22.627c-6.248-6.248-16.379-6.249-22.628 0L184 302.745l-70.059-70.059c-6.248-6.248-16.379-6.248-22.628 0l-22.627 22.627c-6.248 6.248-6.248 16.379 0 22.627l104 104c6.249 6.25 16.379 6.25 22.628.001z"/></svg> **Session 2** gave you an overview of the purpose of serosurveillance and insights into the COVID-19 sero-surveys that have been carried out in PNG -- #### <svg aria-hidden="true" role="img" viewBox="0 0 448 512" style="height:1em;width:0.88em;vertical-align:-0.125em;margin-left:auto;margin-right:auto;font-size:inherit;fill:currentColor;overflow:visible;position:relative;"><path d="M400 480H48c-26.51 0-48-21.49-48-48V80c0-26.51 21.49-48 48-48h352c26.51 0 48 21.49 48 48v352c0 26.51-21.49 48-48 48zm-204.686-98.059l184-184c6.248-6.248 6.248-16.379 0-22.627l-22.627-22.627c-6.248-6.248-16.379-6.249-22.628 0L184 302.745l-70.059-70.059c-6.248-6.248-16.379-6.248-22.628 0l-22.627 22.627c-6.248 6.248-6.248 16.379 0 22.627l104 104c6.249 6.25 16.379 6.25 22.628.001z"/></svg> **[Session 3](https://shaziaruybal.github.io/covidClassifyR-workshop/sessions/2022-03-10-session3/index.html)** gave you an overview of the [`covidClassifyR`](https://shaziaruybal.shinyapps.io/covidclassifyr) Shiny app -- #### <svg aria-hidden="true" role="img" viewBox="0 0 448 512" style="height:1em;width:0.88em;vertical-align:-0.125em;margin-left:auto;margin-right:auto;font-size:inherit;fill:currentColor;overflow:visible;position:relative;"><path d="M400 480H48c-26.51 0-48-21.49-48-48V80c0-26.51 21.49-48 48-48h352c26.51 0 48 21.49 48 48v352c0 26.51-21.49 48-48 48zm-204.686-98.059l184-184c6.248-6.248 6.248-16.379 0-22.627l-22.627-22.627c-6.248-6.248-16.379-6.249-22.628 0L184 302.745l-70.059-70.059c-6.248-6.248-16.379-6.248-22.628 0l-22.627 22.627c-6.248 6.248-6.248 16.379 0 22.627l104 104c6.249 6.25 16.379 6.25 22.628.001z"/></svg> **[Session 4](https://shaziaruybal.github.io/covidClassifyR-workshop/sessions/2022-03-11-session4/index.html)** gave you an overview of how to prepare and import your data to the [`covidClassifyR`](https://shaziaruybal.shinyapps.io/covidclassifyr) Shiny app -- .footnote[ For all the workshop materials see the [workshop website <svg aria-hidden="true" role="img" viewBox="0 0 512 512" style="height:1em;width:1em;vertical-align:-0.125em;margin-left:auto;margin-right:auto;font-size:inherit;fill:currentColor;overflow:visible;position:relative;"><path d="M432,320H400a16,16,0,0,0-16,16V448H64V128H208a16,16,0,0,0,16-16V80a16,16,0,0,0-16-16H48A48,48,0,0,0,0,112V464a48,48,0,0,0,48,48H400a48,48,0,0,0,48-48V336A16,16,0,0,0,432,320ZM488,0h-128c-21.37,0-32.05,25.91-17,41l35.73,35.73L135,320.37a24,24,0,0,0,0,34L157.67,377a24,24,0,0,0,34,0L435.28,133.32,471,169c15,15,41,4.5,41-17V24A24,24,0,0,0,488,0Z"/></svg>](https://shaziaruybal.github.io/covidClassifyR-workshop/materials.html) ] --- class: center # <svg aria-hidden="true" role="img" viewBox="0 0 640 512" style="height:1em;width:1.25em;vertical-align:-0.125em;margin-left:auto;margin-right:auto;font-size:inherit;fill:currentColor;overflow:visible;position:relative;"><path d="M96 64h448v352h64V40c0-22.06-17.94-40-40-40H72C49.94 0 32 17.94 32 40v376h64V64zm528 384H480v-64H288v64H16c-8.84 0-16 7.16-16 16v32c0 8.84 7.16 16 16 16h608c8.84 0 16-7.16 16-16v-32c0-8.84-7.16-16-16-16z"/></svg> # Today we will cover: -- ### How to perform quality control of your Luminex data -- ### How to interpet the QC plots -- ### You can find the app [here <svg aria-hidden="true" role="img" viewBox="0 0 512 512" style="height:1em;width:1em;vertical-align:-0.125em;margin-left:auto;margin-right:auto;font-size:inherit;fill:currentColor;overflow:visible;position:relative;"><path d="M432,320H400a16,16,0,0,0-16,16V448H64V128H208a16,16,0,0,0,16-16V80a16,16,0,0,0-16-16H48A48,48,0,0,0,0,112V464a48,48,0,0,0,48,48H400a48,48,0,0,0,48-48V336A16,16,0,0,0,432,320ZM488,0h-128c-21.37,0-32.05,25.91-17,41l35.73,35.73L135,320.37a24,24,0,0,0,0,34L157.67,377a24,24,0,0,0,34,0L435.28,133.32,471,169c15,15,41,4.5,41-17V24A24,24,0,0,0,488,0Z"/></svg>](https://shaziaruybal.shinyapps.io/covidClassifyR) --- class: inverse, middle, center # <svg aria-hidden="true" role="img" viewBox="0 0 384 512" style="height:1em;width:0.75em;vertical-align:-0.125em;margin-left:auto;margin-right:auto;font-size:inherit;fill:currentColor;overflow:visible;position:relative;"><path d="M336 64h-80c0-35.3-28.7-64-64-64s-64 28.7-64 64H48C21.5 64 0 85.5 0 112v352c0 26.5 21.5 48 48 48h288c26.5 0 48-21.5 48-48V112c0-26.5-21.5-48-48-48zM192 40c13.3 0 24 10.7 24 24s-10.7 24-24 24-24-10.7-24-24 10.7-24 24-24zm121.2 231.8l-143 141.8c-4.7 4.7-12.3 4.6-17-.1l-82.6-83.3c-4.7-4.7-4.6-12.3.1-17L99.1 285c4.7-4.7 12.3-4.6 17 .1l46 46.4 106-105.2c4.7-4.7 12.3-4.6 17 .1l28.2 28.4c4.7 4.8 4.6 12.3-.1 17z"/></svg> ## Quality control -- ### Note all of the plots in this interactive section will be downloaded in your QC report! --- ## Check your standard curves .left-column[ The standard curve plots are generated from the antibody data from the standards you indicated in your plate layout (e.g. S1-S10) and median fluorescent intensity (MFI) units are displayed in log10-scale. Remember that there are 11 antigens in the COVID-19 assay panel, all of the COVID-19 antigens start with a "C". **<svg aria-hidden="true" role="img" viewBox="0 0 352 512" style="height:1em;width:0.69em;vertical-align:-0.125em;margin-left:auto;margin-right:auto;font-size:inherit;fill:currentColor;overflow:visible;position:relative;"><path d="M96.06 454.35c.01 6.29 1.87 12.45 5.36 17.69l17.09 25.69a31.99 31.99 0 0 0 26.64 14.28h61.71a31.99 31.99 0 0 0 26.64-14.28l17.09-25.69a31.989 31.989 0 0 0 5.36-17.69l.04-38.35H96.01l.05 38.35zM0 176c0 44.37 16.45 84.85 43.56 115.78 16.52 18.85 42.36 58.23 52.21 91.45.04.26.07.52.11.78h160.24c.04-.26.07-.51.11-.78 9.85-33.22 35.69-72.6 52.21-91.45C335.55 260.85 352 220.37 352 176 352 78.61 272.91-.3 175.45 0 73.44.31 0 82.97 0 176zm176-80c-44.11 0-80 35.89-80 80 0 8.84-7.16 16-16 16s-16-7.16-16-16c0-61.76 50.24-112 112-112 8.84 0 16 7.16 16 16s-7.16 16-16 16z"/></svg> Tip:** In general your standard curves should look relatively linear (only when the y-axis is on logarithmic scale). ] .right-column[  ] --- # Check your plate bead counts .left-column[ A summary of the bead counts for each plate well are displayed, with blue indicating there are sufficient beads (>15) or red when there are not enough. If any of the wells are red, they should be double-checked manually and re-run on a new plate if required. ] .right-column[  ] --- # Check your blank samples .left-column[ The median fluorescent intensity (MFI) units for each antigen is displayed for your blank samples. In general, each blank sample should have <50 MFI for each antigen, if they are higher they should be cross-checked manually. **<svg aria-hidden="true" role="img" viewBox="0 0 352 512" style="height:1em;width:0.69em;vertical-align:-0.125em;margin-left:auto;margin-right:auto;font-size:inherit;fill:currentColor;overflow:visible;position:relative;"><path d="M96.06 454.35c.01 6.29 1.87 12.45 5.36 17.69l17.09 25.69a31.99 31.99 0 0 0 26.64 14.28h61.71a31.99 31.99 0 0 0 26.64-14.28l17.09-25.69a31.989 31.989 0 0 0 5.36-17.69l.04-38.35H96.01l.05 38.35zM0 176c0 44.37 16.45 84.85 43.56 115.78 16.52 18.85 42.36 58.23 52.21 91.45.04.26.07.52.11.78h160.24c.04-.26.07-.51.11-.78 9.85-33.22 35.69-72.6 52.21-91.45C335.55 260.85 352 220.37 352 176 352 78.61 272.91-.3 175.45 0 73.44.31 0 82.97 0 176zm176-80c-44.11 0-80 35.89-80 80 0 8.84-7.16 16-16 16s-16-7.16-16-16c0-61.76 50.24-112 112-112 8.84 0 16 7.16 16 16s-7.16 16-16 16z"/></svg> Tip:** If you have more than one blank sample, make sure you label them differently in your plate layout (e.g. Blank1, Blank2), otherwise the figure will display cumulative MFI values for all your blank samples. ] .right-column[  ] --- .pull-left[ ## Automated curve fitting for our Luminex multiplex assay The standard curve on each plate allows us to use the median fluorescence intensity (MFI) values recorded for each standard known concentration/dilution to estimate the antibody concentration for each unknown sample. When plotting the relationship between MFI and antibody concentration for our multiplex serological assay, it results in "S"-shaped curves, which is due to the non-linear relationship between MFI and antibody concentration. To account for the assymetry in this non-linear relationship, we can fit a logistic regression model using 4 parameters (4PL). .footenote[ .bottom[ _[Resource <svg aria-hidden="true" role="img" viewBox="0 0 512 512" style="height:1em;width:1em;vertical-align:-0.125em;margin-left:auto;margin-right:auto;font-size:inherit;fill:currentColor;overflow:visible;position:relative;"><path d="M432,320H400a16,16,0,0,0-16,16V448H64V128H208a16,16,0,0,0,16-16V80a16,16,0,0,0-16-16H48A48,48,0,0,0,0,112V464a48,48,0,0,0,48,48H400a48,48,0,0,0,48-48V336A16,16,0,0,0,432,320ZM488,0h-128c-21.37,0-32.05,25.91-17,41l35.73,35.73L135,320.37a24,24,0,0,0,0,34L157.67,377a24,24,0,0,0,34,0L435.28,133.32,471,169c15,15,41,4.5,41-17V24A24,24,0,0,0,488,0Z"/></svg>](https://www.biolegend.com/en-us/blog/curve-fitting-for-immunoassays-legendplex)_ ]] ] .pull-right[ <img src="img/4pl_model.png" width="650" height="550" /> ] --- .pull-left[ ## Automated curve fitting for our Luminex multiplex assay However, for more complex multiplex assays it is more appropriate to also account for the asymmetry to provide a better fit (by including the asymmetry factor). This is called a 5-parameter logistic (5PL) regression model. .footnote[ .bottom[ _[Resource <svg aria-hidden="true" role="img" viewBox="0 0 512 512" style="height:1em;width:1em;vertical-align:-0.125em;margin-left:auto;margin-right:auto;font-size:inherit;fill:currentColor;overflow:visible;position:relative;"><path d="M432,320H400a16,16,0,0,0-16,16V448H64V128H208a16,16,0,0,0,16-16V80a16,16,0,0,0-16-16H48A48,48,0,0,0,0,112V464a48,48,0,0,0,48,48H400a48,48,0,0,0,48-48V336A16,16,0,0,0,432,320ZM488,0h-128c-21.37,0-32.05,25.91-17,41l35.73,35.73L135,320.37a24,24,0,0,0,0,34L157.67,377a24,24,0,0,0,34,0L435.28,133.32,471,169c15,15,41,4.5,41-17V24A24,24,0,0,0,488,0Z"/></svg>](https://www.biolegend.com/en-us/blog/curve-fitting-for-immunoassays-legendplex)_ ]] ] .pull-right[ <img src="img/5pl_model.png" width="650" height="350" /> ] --- # Check your model results .left-column[ The automated data processing in this app allows you to convert your median fluorescence intensity (MFI) data into relative antibody units (RAU) by fitting a 5-parameter logistic (5PL) regression model to the standard curve on a per-antigen level. This log-log model is used to obtain a more linear relationship. **<svg aria-hidden="true" role="img" viewBox="0 0 352 512" style="height:1em;width:0.69em;vertical-align:-0.125em;margin-left:auto;margin-right:auto;font-size:inherit;fill:currentColor;overflow:visible;position:relative;"><path d="M96.06 454.35c.01 6.29 1.87 12.45 5.36 17.69l17.09 25.69a31.99 31.99 0 0 0 26.64 14.28h61.71a31.99 31.99 0 0 0 26.64-14.28l17.09-25.69a31.989 31.989 0 0 0 5.36-17.69l.04-38.35H96.01l.05 38.35zM0 176c0 44.37 16.45 84.85 43.56 115.78 16.52 18.85 42.36 58.23 52.21 91.45.04.26.07.52.11.78h160.24c.04-.26.07-.51.11-.78 9.85-33.22 35.69-72.6 52.21-91.45C335.55 260.85 352 220.37 352 176 352 78.61 272.91-.3 175.45 0 73.44.31 0 82.97 0 176zm176-80c-44.11 0-80 35.89-80 80 0 8.84-7.16 16-16 16s-16-7.16-16-16c0-61.76 50.24-112 112-112 8.84 0 16 7.16 16 16s-7.16 16-16 16z"/></svg> Tip:** In general your model results for each antigen should look relatively linear. ] .right-column[  ] --- # Check the processed data .left-column[ The results from the data processing are displayed in an interactive table within the app. The raw median fluorescent intensity (MFI) units and converted relative antibody units (RAU) are displayed for each antigen and for each sample. <svg aria-hidden="true" role="img" viewBox="0 0 448 512" style="height:1em;width:0.88em;vertical-align:-0.125em;margin-left:auto;margin-right:auto;font-size:inherit;fill:currentColor;overflow:visible;position:relative;"><path d="M400 480H48c-26.51 0-48-21.49-48-48V80c0-26.51 21.49-48 48-48h352c26.51 0 48 21.49 48 48v352c0 26.51-21.49 48-48 48zm-204.686-98.059l184-184c6.248-6.248 6.248-16.379 0-22.627l-22.627-22.627c-6.248-6.248-16.379-6.249-22.628 0L184 302.745l-70.059-70.059c-6.248-6.248-16.379-6.248-22.628 0l-22.627 22.627c-6.248 6.248-6.248 16.379 0 22.627l104 104c6.249 6.25 16.379 6.25 22.628.001z"/></svg> Scroll to the right to explore data for all antigens <svg aria-hidden="true" role="img" viewBox="0 0 448 512" style="height:1em;width:0.88em;vertical-align:-0.125em;margin-left:auto;margin-right:auto;font-size:inherit;fill:currentColor;overflow:visible;position:relative;"><path d="M400 480H48c-26.51 0-48-21.49-48-48V80c0-26.51 21.49-48 48-48h352c26.51 0 48 21.49 48 48v352c0 26.51-21.49 48-48 48zm-204.686-98.059l184-184c6.248-6.248 6.248-16.379 0-22.627l-22.627-22.627c-6.248-6.248-16.379-6.249-22.628 0L184 302.745l-70.059-70.059c-6.248-6.248-16.379-6.248-22.628 0l-22.627 22.627c-6.248 6.248-6.248 16.379 0 22.627l104 104c6.249 6.25 16.379 6.25 22.628.001z"/></svg> Navigate to different pages to view all samples <svg aria-hidden="true" role="img" viewBox="0 0 448 512" style="height:1em;width:0.88em;vertical-align:-0.125em;margin-left:auto;margin-right:auto;font-size:inherit;fill:currentColor;overflow:visible;position:relative;"><path d="M400 480H48c-26.51 0-48-21.49-48-48V80c0-26.51 21.49-48 48-48h352c26.51 0 48 21.49 48 48v352c0 26.51-21.49 48-48 48zm-204.686-98.059l184-184c6.248-6.248 6.248-16.379 0-22.627l-22.627-22.627c-6.248-6.248-16.379-6.249-22.628 0L184 302.745l-70.059-70.059c-6.248-6.248-16.379-6.248-22.628 0l-22.627 22.627c-6.248 6.248-6.248 16.379 0 22.627l104 104c6.249 6.25 16.379 6.25 22.628.001z"/></svg> Sort & filter as needed! ] .right-column[  **<svg aria-hidden="true" role="img" viewBox="0 0 352 512" style="height:1em;width:0.69em;vertical-align:-0.125em;margin-left:auto;margin-right:auto;font-size:inherit;fill:currentColor;overflow:visible;position:relative;"><path d="M96.06 454.35c.01 6.29 1.87 12.45 5.36 17.69l17.09 25.69a31.99 31.99 0 0 0 26.64 14.28h61.71a31.99 31.99 0 0 0 26.64-14.28l17.09-25.69a31.989 31.989 0 0 0 5.36-17.69l.04-38.35H96.01l.05 38.35zM0 176c0 44.37 16.45 84.85 43.56 115.78 16.52 18.85 42.36 58.23 52.21 91.45.04.26.07.52.11.78h160.24c.04-.26.07-.51.11-.78 9.85-33.22 35.69-72.6 52.21-91.45C335.55 260.85 352 220.37 352 176 352 78.61 272.91-.3 175.45 0 73.44.31 0 82.97 0 176zm176-80c-44.11 0-80 35.89-80 80 0 8.84-7.16 16-16 16s-16-7.16-16-16c0-61.76 50.24-112 112-112 8.84 0 16 7.16 16 16s-7.16 16-16 16z"/></svg> Tip:** Check that the number of entries is as expected baed on the number of unknown samples in your plate layout and that RAU values have been calculated for all of your antigens. ] --- # <svg aria-hidden="true" role="img" viewBox="0 0 640 512" style="height:1em;width:1.25em;vertical-align:-0.125em;margin-left:auto;margin-right:auto;font-size:inherit;fill:currentColor;overflow:visible;position:relative;"><path d="M255.03 261.65c6.25 6.25 16.38 6.25 22.63 0l11.31-11.31c6.25-6.25 6.25-16.38 0-22.63L253.25 192l35.71-35.72c6.25-6.25 6.25-16.38 0-22.63l-11.31-11.31c-6.25-6.25-16.38-6.25-22.63 0l-58.34 58.34c-6.25 6.25-6.25 16.38 0 22.63l58.35 58.34zm96.01-11.3l11.31 11.31c6.25 6.25 16.38 6.25 22.63 0l58.34-58.34c6.25-6.25 6.25-16.38 0-22.63l-58.34-58.34c-6.25-6.25-16.38-6.25-22.63 0l-11.31 11.31c-6.25 6.25-6.25 16.38 0 22.63L386.75 192l-35.71 35.72c-6.25 6.25-6.25 16.38 0 22.63zM624 416H381.54c-.74 19.81-14.71 32-32.74 32H288c-18.69 0-33.02-17.47-32.77-32H16c-8.8 0-16 7.2-16 16v16c0 35.2 28.8 64 64 64h512c35.2 0 64-28.8 64-64v-16c0-8.8-7.2-16-16-16zM576 48c0-26.4-21.6-48-48-48H112C85.6 0 64 21.6 64 48v336h512V48zm-64 272H128V64h384v256z"/></svg> Demo <video width="1330" height="410" controls> <source src="screen_records/qc_demo.mp4" type="video/mp4"> </video> --- class: inverse, middle, center # <svg aria-hidden="true" role="img" viewBox="0 0 384 512" style="height:1em;width:0.75em;vertical-align:-0.125em;margin-left:auto;margin-right:auto;font-size:inherit;fill:currentColor;overflow:visible;position:relative;"><path d="M336 64h-80c0-35.3-28.7-64-64-64s-64 28.7-64 64H48C21.5 64 0 85.5 0 112v352c0 26.5 21.5 48 48 48h288c26.5 0 48-21.5 48-48V112c0-26.5-21.5-48-48-48zM192 40c13.3 0 24 10.7 24 24s-10.7 24-24 24-24-10.7-24-24 10.7-24 24-24zm121.2 231.8l-143 141.8c-4.7 4.7-12.3 4.6-17-.1l-82.6-83.3c-4.7-4.7-4.6-12.3.1-17L99.1 285c4.7-4.7 12.3-4.6 17 .1l46 46.4 106-105.2c4.7-4.7 12.3-4.6 17 .1l28.2 28.4c4.7 4.8 4.6 12.3-.1 17z"/></svg> ## Next session: ### Download your processed data and QC report --- # Acknowledgments - Dr Maria Ome-Kaius and Dr Fiona Angrisano - PNGIMR and partner institutions - WEHI & Burnet Institute - All of you for attending! *We are extremely grateful for financial support to develop and host the covidClassifyR Shiny web application, and to host these virtual workshops through the [Regional Collaborations Programme COVID-19 Digital Grant](https://www.science.org.au/news-and-events/news-and-media-releases/regional-research-set-get-digital-boost) from the Australian Academy of Science and Australian Department of Industry, Science, Energy and Resources.* The scripts and functions used in [`covidClassifyR`](https://shaziaruybal.shinyapps.io/covidclassifyr) were developed by Shazia Ruybal-Pesántez, with contributions from the following researchers: Eamon Conway, Connie Li Wan Suen, Narimane Nekkab and Michael White. .footnote[ _These slides were created using the R packages: [xaringan](https://github.com/yihui/xaringan), [xaringanthemer](https://github.com/gadenbuie/xaringanthemer), [xaringanExtra](https://github.com/gadenbuie/xaringanExtra)_ ] --- name: contact class: inverse .pull-left[ .center[ ### Dr Shazia Ruybal-Pesántez <img style="border-radius: 50%;" src="https://shaziaruybal.github.io/covidClassifyR-workshop/images/shazia.png" width="250px"/> #### Contact details [<svg aria-hidden="true" role="img" viewBox="0 0 512 512" style="height:1em;width:1em;vertical-align:-0.125em;margin-left:auto;margin-right:auto;font-size:inherit;fill:currentColor;overflow:visible;position:relative;"><path d="M502.3 190.8c3.9-3.1 9.7-.2 9.7 4.7V400c0 26.5-21.5 48-48 48H48c-26.5 0-48-21.5-48-48V195.6c0-5 5.7-7.8 9.7-4.7 22.4 17.4 52.1 39.5 154.1 113.6 21.1 15.4 56.7 47.8 92.2 47.6 35.7.3 72-32.8 92.3-47.6 102-74.1 131.6-96.3 154-113.7zM256 320c23.2.4 56.6-29.2 73.4-41.4 132.7-96.3 142.8-104.7 173.4-128.7 5.8-4.5 9.2-11.5 9.2-18.9v-19c0-26.5-21.5-48-48-48H48C21.5 64 0 85.5 0 112v19c0 7.4 3.4 14.3 9.2 18.9 30.6 23.9 40.7 32.4 173.4 128.7 16.8 12.2 50.2 41.8 73.4 41.4z"/></svg> ruybal.s@wehi.edu.au](mailto:ruybal.s@wehi.edu.au) [<svg aria-hidden="true" role="img" viewBox="0 0 512 512" style="height:1em;width:1em;vertical-align:-0.125em;margin-left:auto;margin-right:auto;font-size:inherit;fill:currentColor;overflow:visible;position:relative;"><path d="M459.37 151.716c.325 4.548.325 9.097.325 13.645 0 138.72-105.583 298.558-298.558 298.558-59.452 0-114.68-17.219-161.137-47.106 8.447.974 16.568 1.299 25.34 1.299 49.055 0 94.213-16.568 130.274-44.832-46.132-.975-84.792-31.188-98.112-72.772 6.498.974 12.995 1.624 19.818 1.624 9.421 0 18.843-1.3 27.614-3.573-48.081-9.747-84.143-51.98-84.143-102.985v-1.299c13.969 7.797 30.214 12.67 47.431 13.319-28.264-18.843-46.781-51.005-46.781-87.391 0-19.492 5.197-37.36 14.294-52.954 51.655 63.675 129.3 105.258 216.365 109.807-1.624-7.797-2.599-15.918-2.599-24.04 0-57.828 46.782-104.934 104.934-104.934 30.213 0 57.502 12.67 76.67 33.137 23.715-4.548 46.456-13.32 66.599-25.34-7.798 24.366-24.366 44.833-46.132 57.827 21.117-2.273 41.584-8.122 60.426-16.243-14.292 20.791-32.161 39.308-52.628 54.253z"/></svg> @DrShaziaRuybal](https://twitter.com/DrShaziaRuybal) ]] .pull-right[ ### Session 5 Resources: ### [<i class="fab fa-youtube "></i> Recording](https://youtu.be/bglxoyCM2LY) ### [<i class="fas fa-laptop-code "></i> `covidClassifyR`](https://shaziaruybal.shinyapps.io/covidClassifyR) ### [<svg aria-hidden="true" role="img" viewBox="0 0 496 512" style="height:1em;width:0.97em;vertical-align:-0.125em;margin-left:auto;margin-right:auto;font-size:inherit;fill:currentColor;overflow:visible;position:relative;"><path d="M336.5 160C322 70.7 287.8 8 248 8s-74 62.7-88.5 152h177zM152 256c0 22.2 1.2 43.5 3.3 64h185.3c2.1-20.5 3.3-41.8 3.3-64s-1.2-43.5-3.3-64H155.3c-2.1 20.5-3.3 41.8-3.3 64zm324.7-96c-28.6-67.9-86.5-120.4-158-141.6 24.4 33.8 41.2 84.7 50 141.6h108zM177.2 18.4C105.8 39.6 47.8 92.1 19.3 160h108c8.7-56.9 25.5-107.8 49.9-141.6zM487.4 192H372.7c2.1 21 3.3 42.5 3.3 64s-1.2 43-3.3 64h114.6c5.5-20.5 8.6-41.8 8.6-64s-3.1-43.5-8.5-64zM120 256c0-21.5 1.2-43 3.3-64H8.6C3.2 212.5 0 233.8 0 256s3.2 43.5 8.6 64h114.6c-2-21-3.2-42.5-3.2-64zm39.5 96c14.5 89.3 48.7 152 88.5 152s74-62.7 88.5-152h-177zm159.3 141.6c71.4-21.2 129.4-73.7 158-141.6h-108c-8.8 56.9-25.6 107.8-50 141.6zM19.3 352c28.6 67.9 86.5 120.4 158 141.6-24.4-33.8-41.2-84.7-50-141.6h-108z"/></svg> Workshop materials](https://shaziaruybal.github.io/covidClassifyR-workshop/materials.html) ### [<svg aria-hidden="true" role="img" viewBox="0 0 512 512" style="height:1em;width:1em;vertical-align:-0.125em;margin-left:auto;margin-right:auto;font-size:inherit;fill:currentColor;overflow:visible;position:relative;"><path d="M464 448H48c-26.51 0-48-21.49-48-48V112c0-26.51 21.49-48 48-48h416c26.51 0 48 21.49 48 48v288c0 26.51-21.49 48-48 48zM112 120c-30.928 0-56 25.072-56 56s25.072 56 56 56 56-25.072 56-56-25.072-56-56-56zM64 384h384V272l-87.515-87.515c-4.686-4.686-12.284-4.686-16.971 0L208 320l-55.515-55.515c-4.686-4.686-12.284-4.686-16.971 0L64 336v48z"/></svg> Slides for Session 5](https://shaziaruybal.github.io/covidClassifyR-workshop/slides/session5/session5_slides.html) ] --- class: inverse, middle, center # <svg aria-hidden="true" role="img" viewBox="0 0 512 512" style="height:1em;width:1em;vertical-align:-0.125em;margin-left:auto;margin-right:auto;font-size:inherit;fill:currentColor;overflow:visible;position:relative;"><path d="M504 256c0 136.997-111.043 248-248 248S8 392.997 8 256C8 119.083 119.043 8 256 8s248 111.083 248 248zM262.655 90c-54.497 0-89.255 22.957-116.549 63.758-3.536 5.286-2.353 12.415 2.715 16.258l34.699 26.31c5.205 3.947 12.621 3.008 16.665-2.122 17.864-22.658 30.113-35.797 57.303-35.797 20.429 0 45.698 13.148 45.698 32.958 0 14.976-12.363 22.667-32.534 33.976C247.128 238.528 216 254.941 216 296v4c0 6.627 5.373 12 12 12h56c6.627 0 12-5.373 12-12v-1.333c0-28.462 83.186-29.647 83.186-106.667 0-58.002-60.165-102-116.531-102zM256 338c-25.365 0-46 20.635-46 46 0 25.364 20.635 46 46 46s46-20.636 46-46c0-25.365-20.635-46-46-46z"/></svg> Questions?