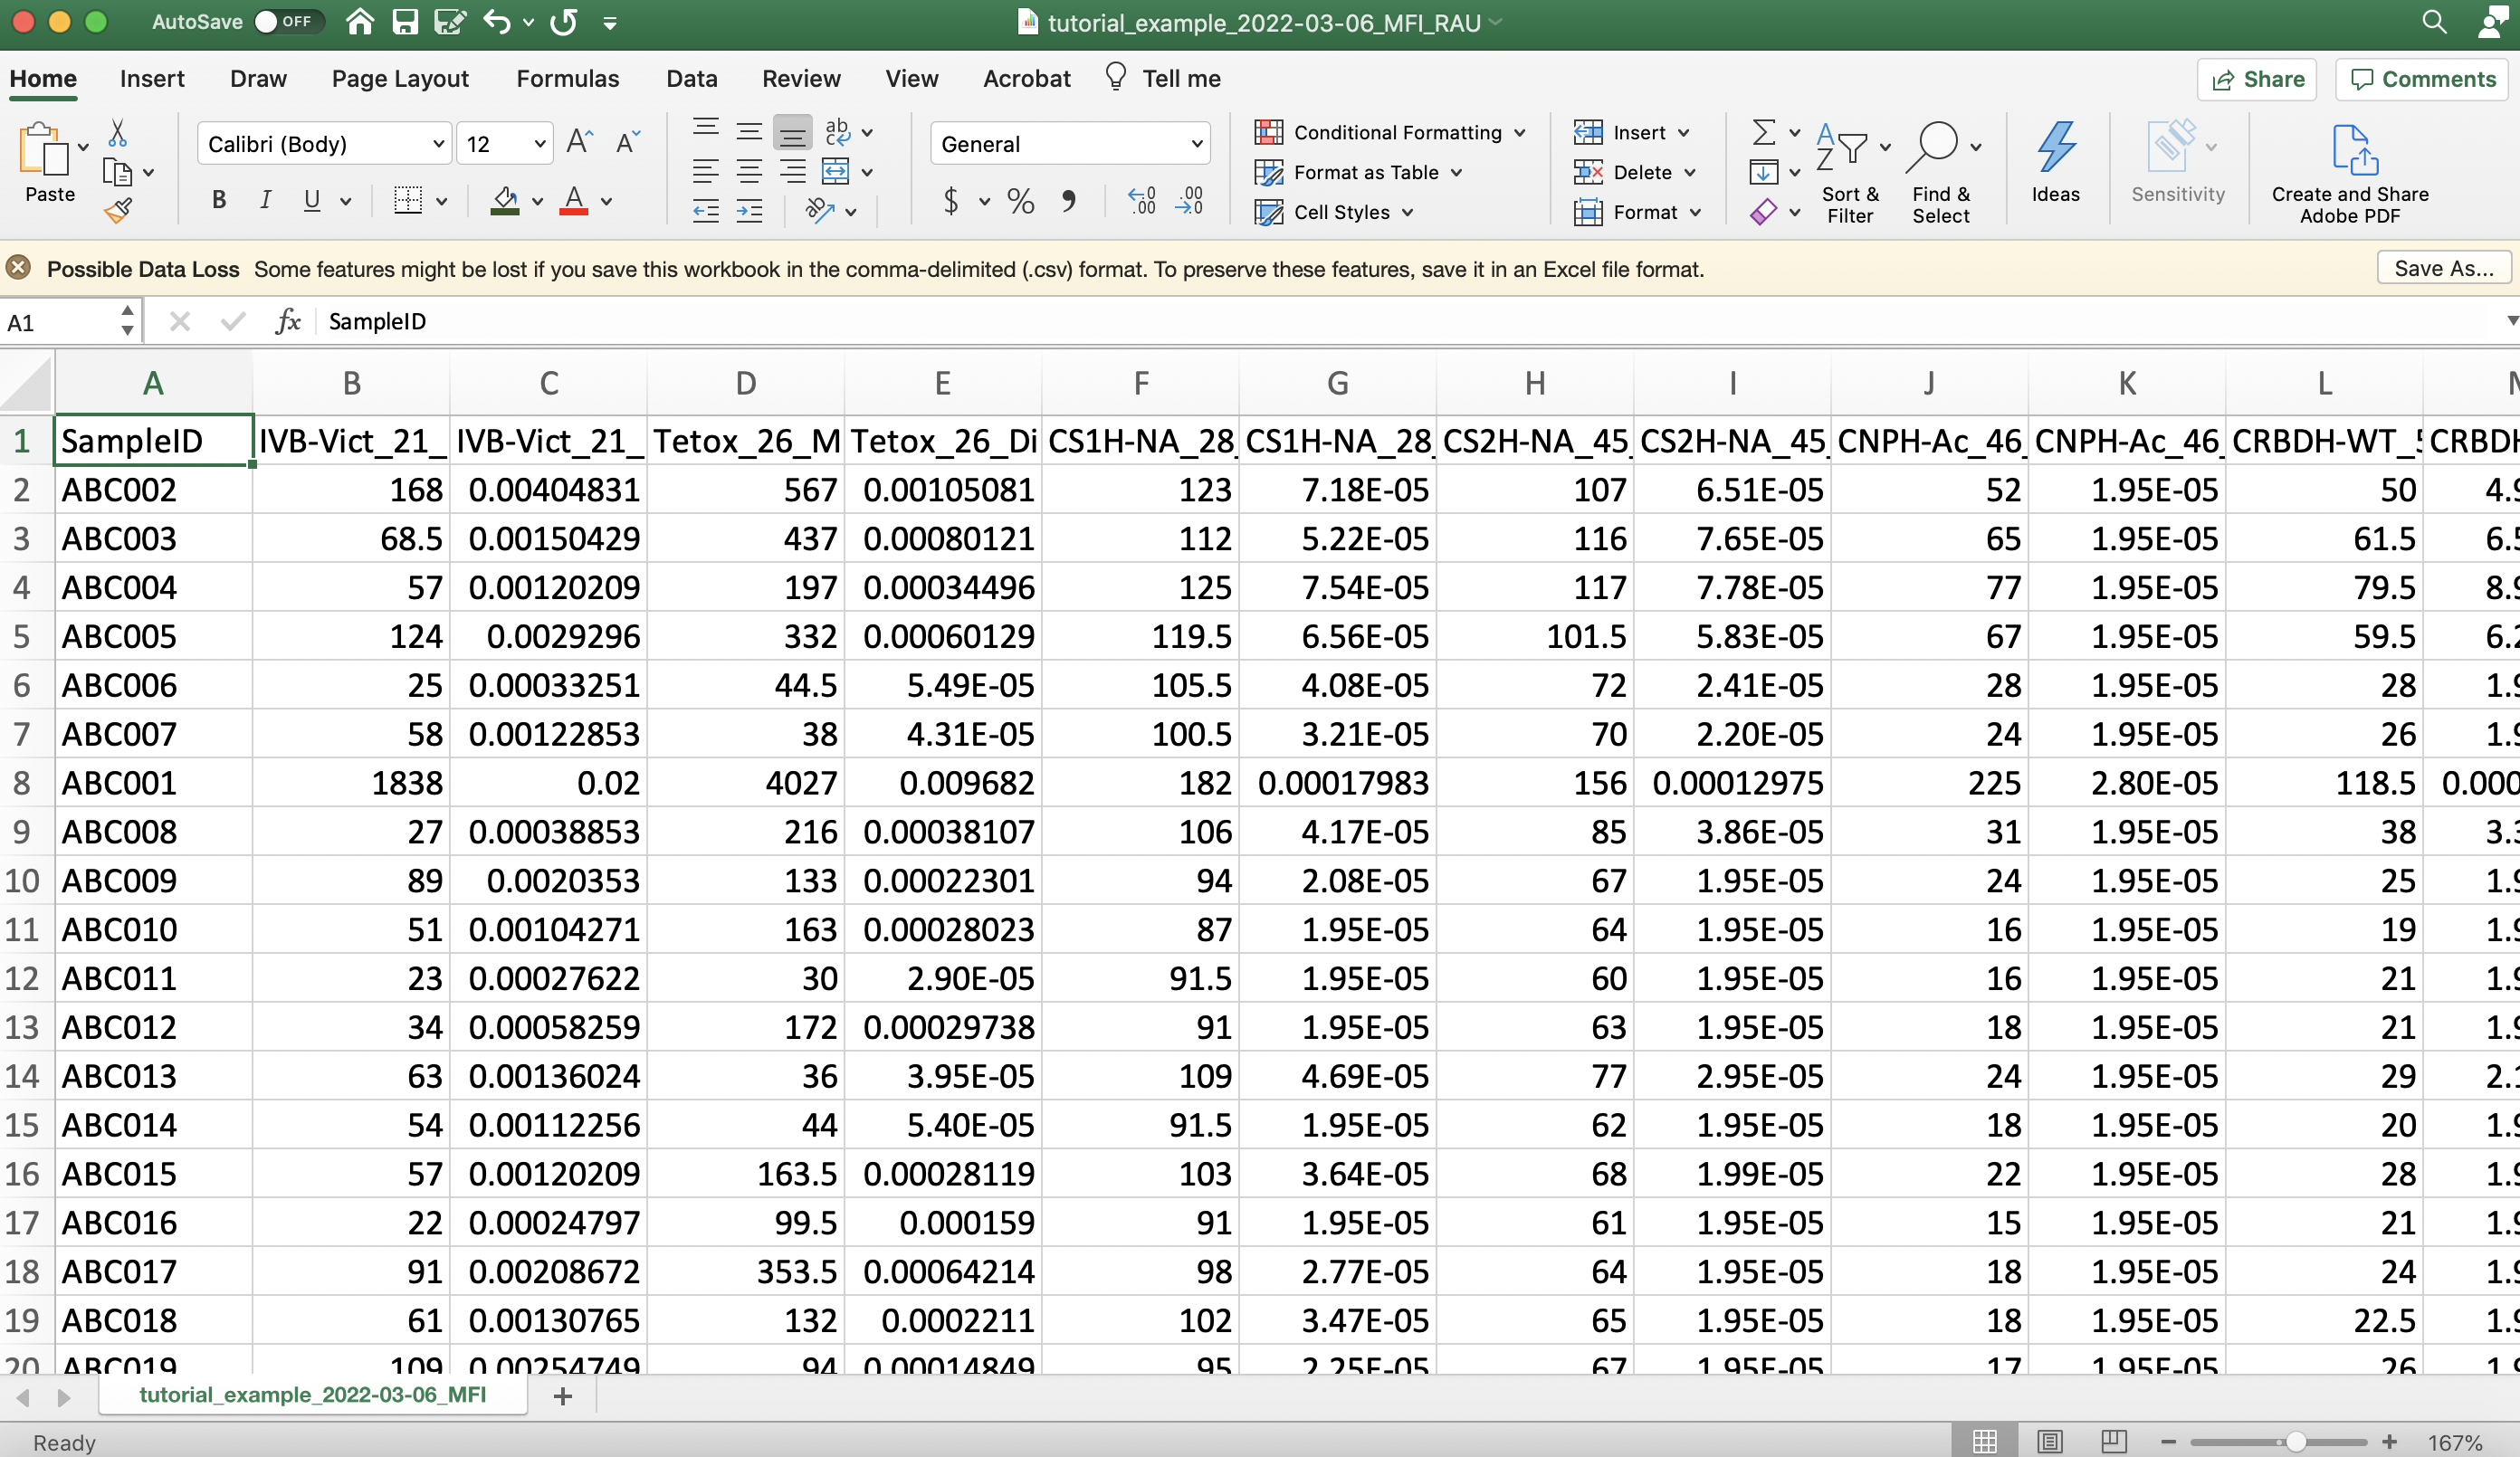
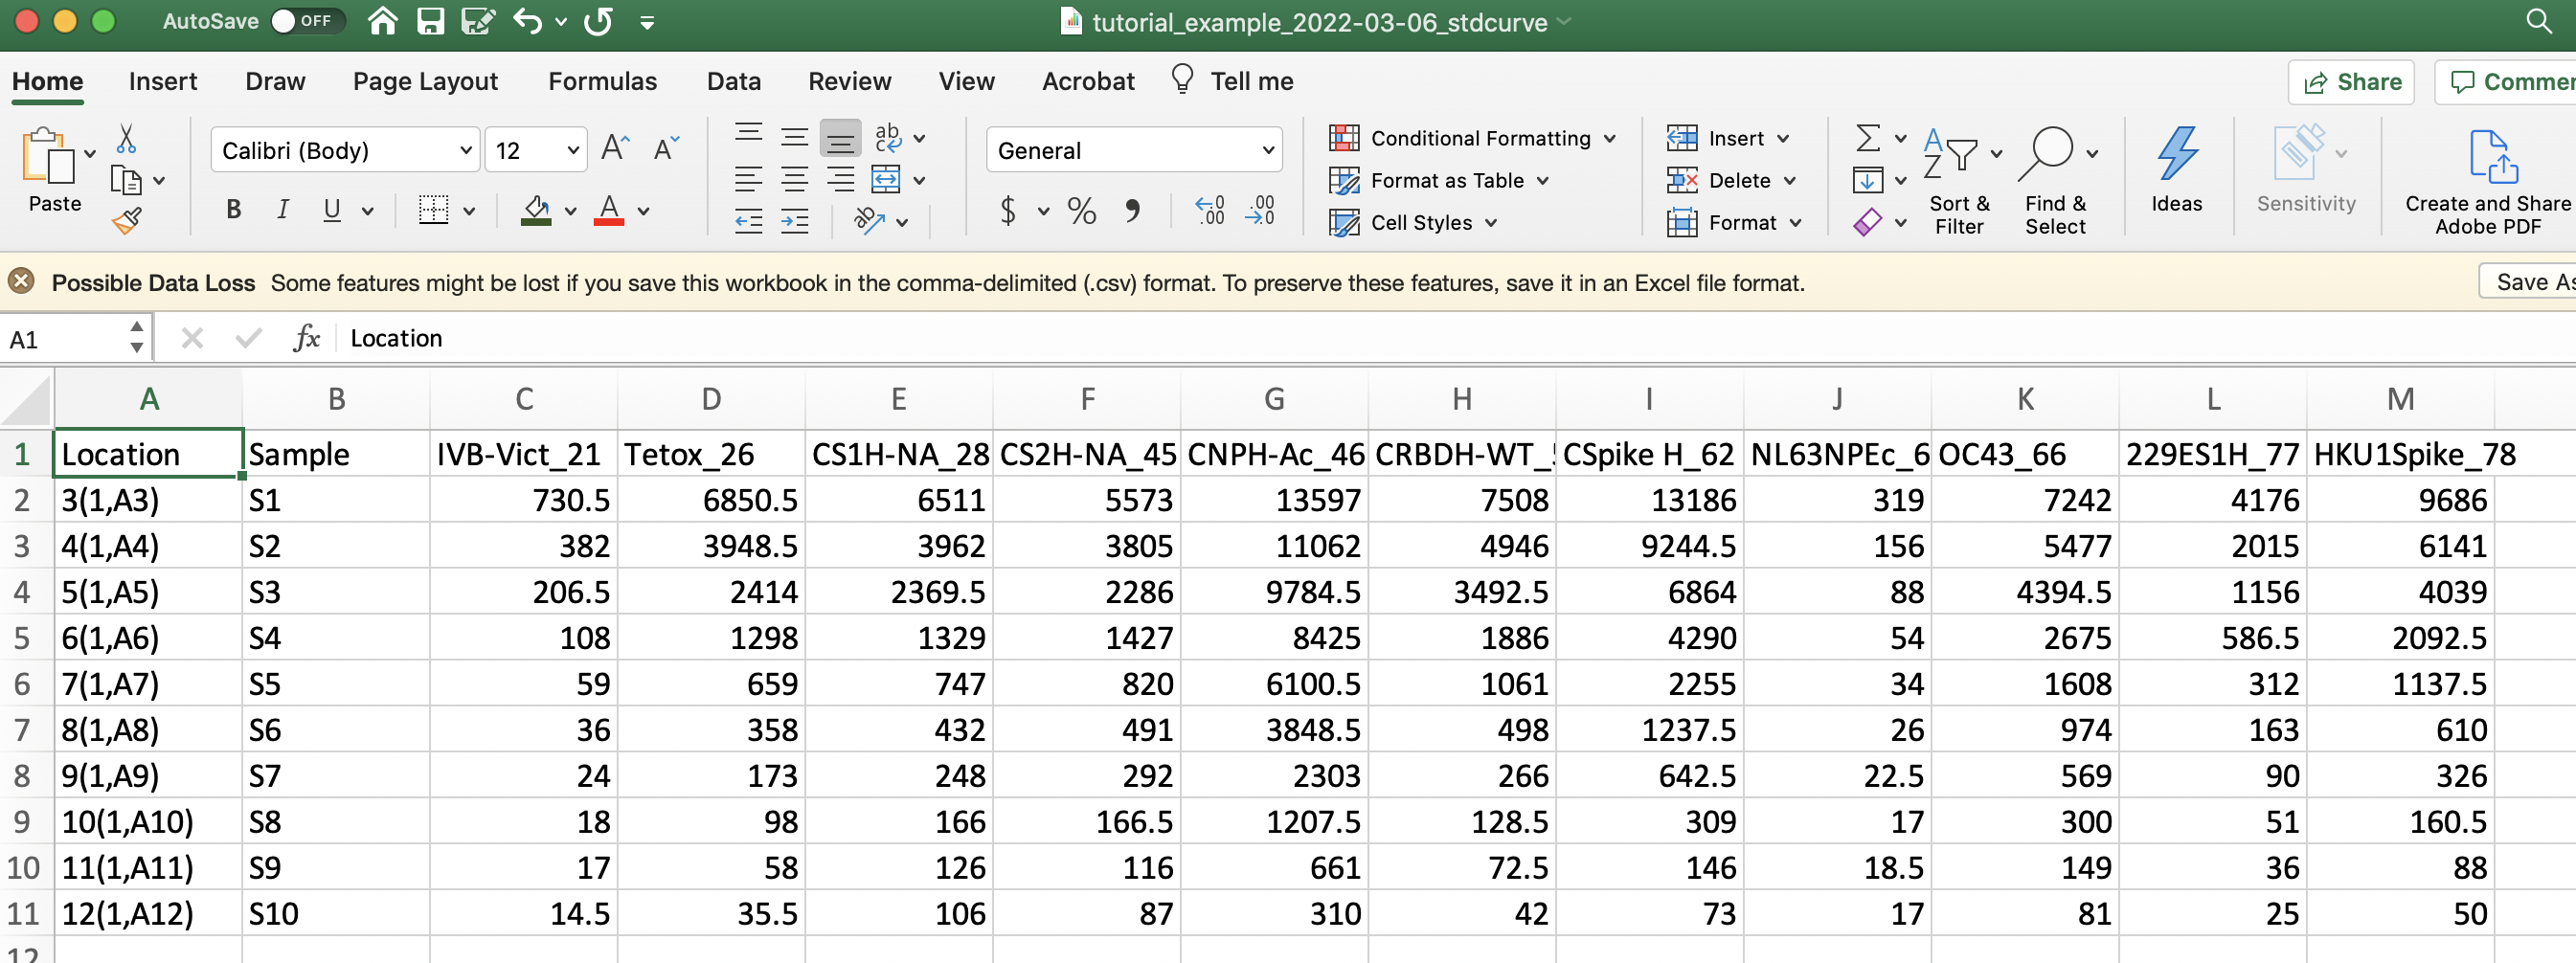
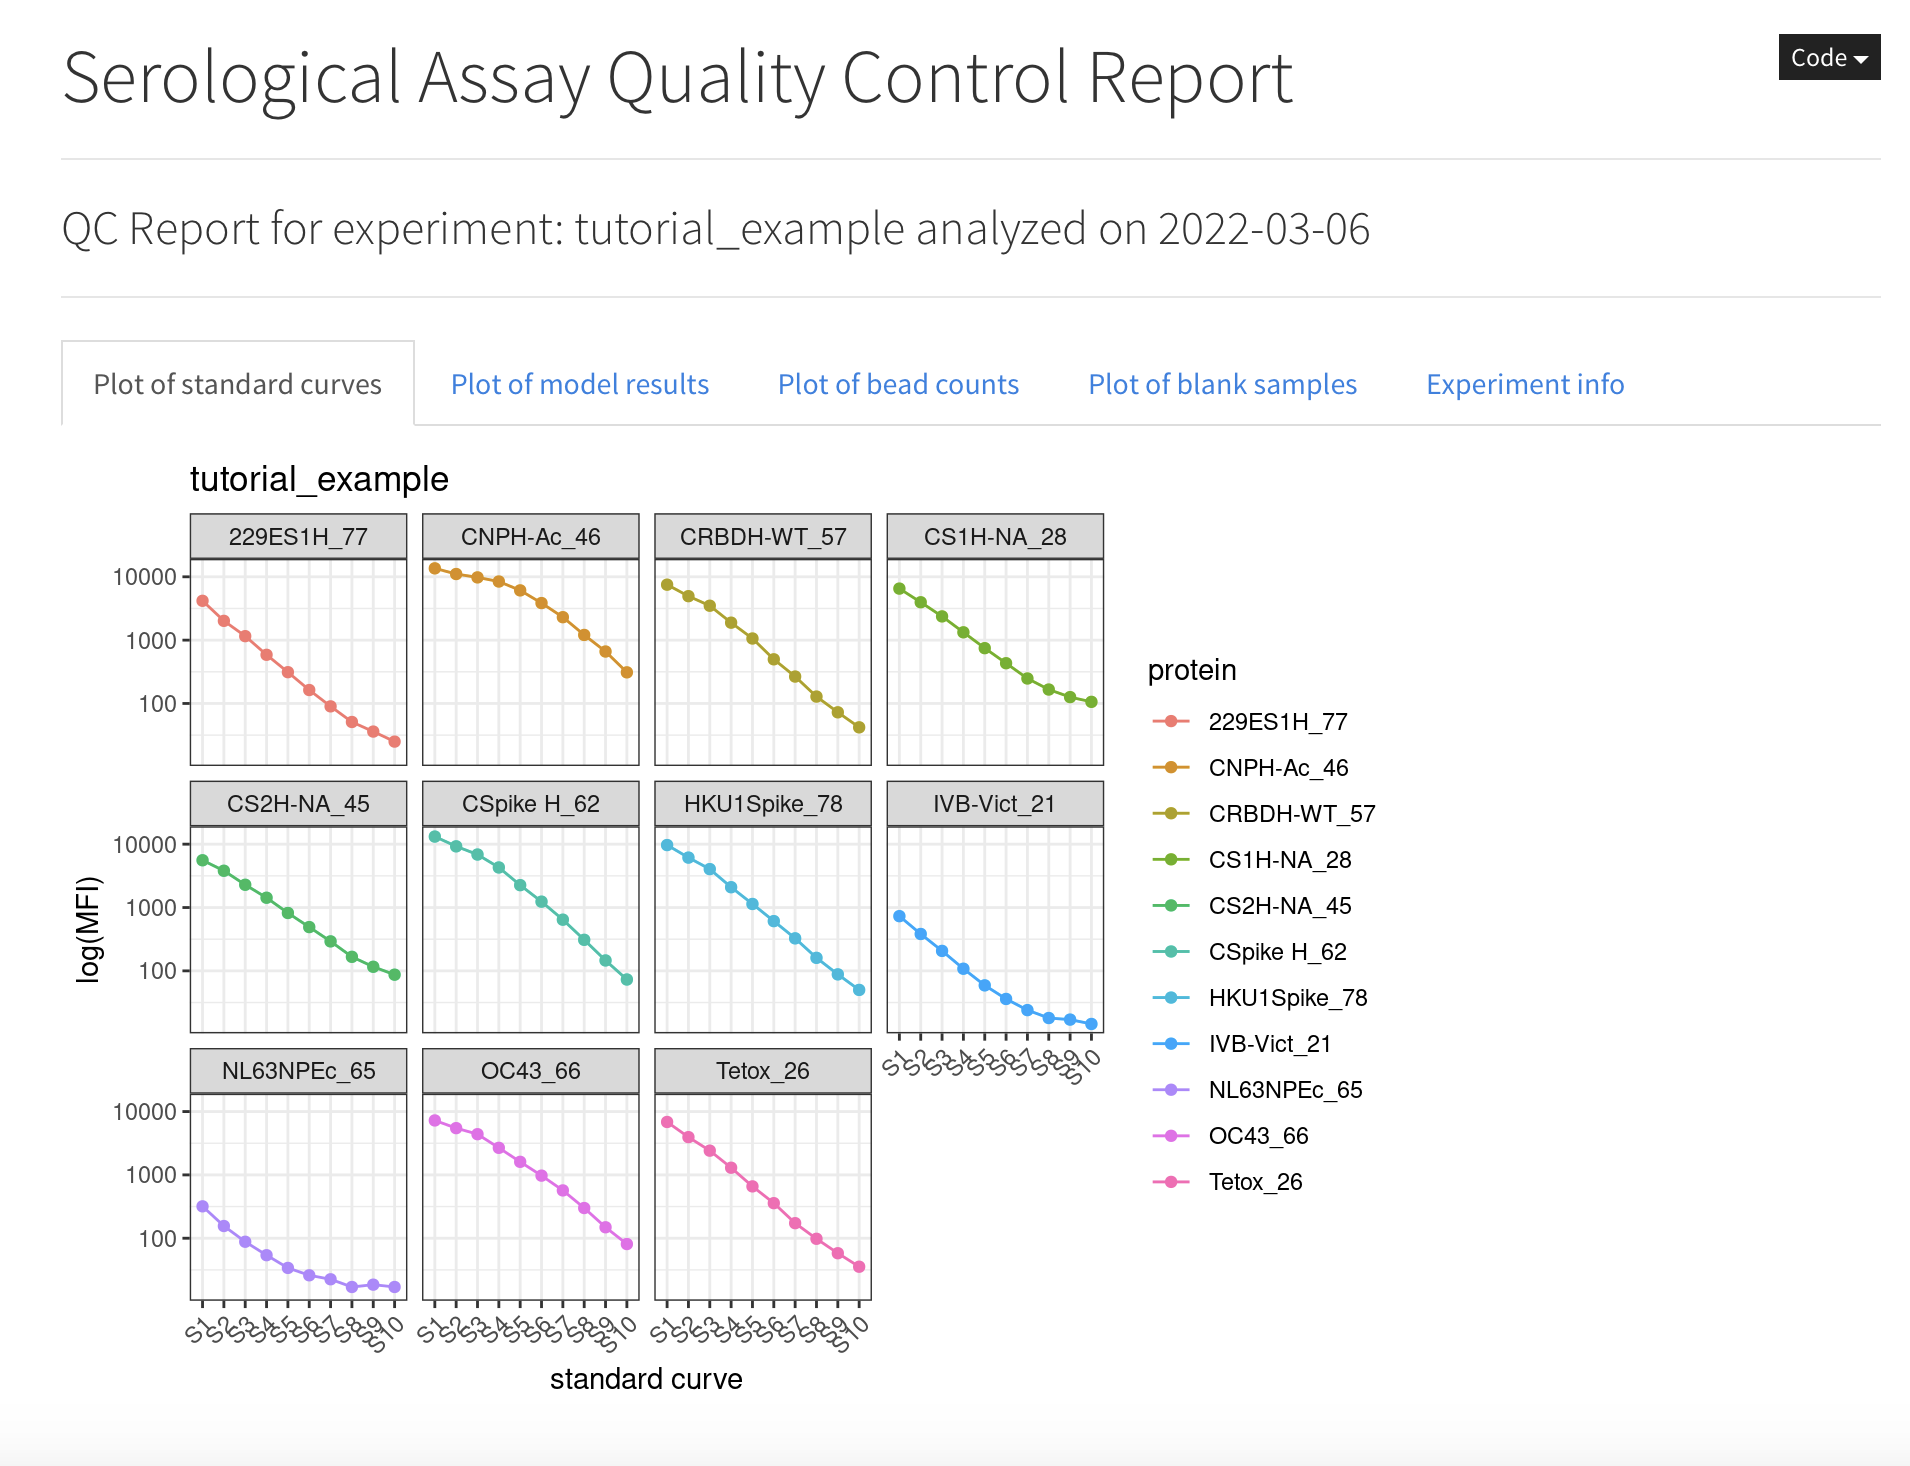
class: title-slide, middle, left ## Session 6: Download your quality control report and processed data ### Dr Shazia Ruybal-Pesántez Presented at the [covidClassifyR Shiny app workshop](https://shaziaruybal.github.io/covidClassifyR-workshop) for researchers from PNGIMR and partner institutions 2022-03-11 --- class: left # Recap -- #### <svg aria-hidden="true" role="img" viewBox="0 0 448 512" style="height:1em;width:0.88em;vertical-align:-0.125em;margin-left:auto;margin-right:auto;font-size:inherit;fill:currentColor;overflow:visible;position:relative;"><path d="M400 480H48c-26.51 0-48-21.49-48-48V80c0-26.51 21.49-48 48-48h352c26.51 0 48 21.49 48 48v352c0 26.51-21.49 48-48 48zm-204.686-98.059l184-184c6.248-6.248 6.248-16.379 0-22.627l-22.627-22.627c-6.248-6.248-16.379-6.249-22.628 0L184 302.745l-70.059-70.059c-6.248-6.248-16.379-6.248-22.628 0l-22.627 22.627c-6.248 6.248-6.248 16.379 0 22.627l104 104c6.249 6.25 16.379 6.25 22.628.001z"/></svg> **[Session 1](https://shaziaruybal.github.io/covidClassifyR-workshop/sessions/2022-03-10-session1/index.html)** gave you an overview of the Luminex technology and the COVID-19 multi-antigen serological assay that was established in PNG -- #### <svg aria-hidden="true" role="img" viewBox="0 0 448 512" style="height:1em;width:0.88em;vertical-align:-0.125em;margin-left:auto;margin-right:auto;font-size:inherit;fill:currentColor;overflow:visible;position:relative;"><path d="M400 480H48c-26.51 0-48-21.49-48-48V80c0-26.51 21.49-48 48-48h352c26.51 0 48 21.49 48 48v352c0 26.51-21.49 48-48 48zm-204.686-98.059l184-184c6.248-6.248 6.248-16.379 0-22.627l-22.627-22.627c-6.248-6.248-16.379-6.249-22.628 0L184 302.745l-70.059-70.059c-6.248-6.248-16.379-6.248-22.628 0l-22.627 22.627c-6.248 6.248-6.248 16.379 0 22.627l104 104c6.249 6.25 16.379 6.25 22.628.001z"/></svg> **Session 2** gave you an overview of the purpose of serosurveillance and insights into the COVID-19 sero-surveys that have been carried out in PNG -- #### <svg aria-hidden="true" role="img" viewBox="0 0 448 512" style="height:1em;width:0.88em;vertical-align:-0.125em;margin-left:auto;margin-right:auto;font-size:inherit;fill:currentColor;overflow:visible;position:relative;"><path d="M400 480H48c-26.51 0-48-21.49-48-48V80c0-26.51 21.49-48 48-48h352c26.51 0 48 21.49 48 48v352c0 26.51-21.49 48-48 48zm-204.686-98.059l184-184c6.248-6.248 6.248-16.379 0-22.627l-22.627-22.627c-6.248-6.248-16.379-6.249-22.628 0L184 302.745l-70.059-70.059c-6.248-6.248-16.379-6.248-22.628 0l-22.627 22.627c-6.248 6.248-6.248 16.379 0 22.627l104 104c6.249 6.25 16.379 6.25 22.628.001z"/></svg> **[Session 3](https://shaziaruybal.github.io/covidClassifyR-workshop/sessions/2022-03-10-session3/index.html)** gave you an overview of the [`covidClassifyR`](https://shaziaruybal.shinyapps.io/covidclassifyr) Shiny app -- #### <svg aria-hidden="true" role="img" viewBox="0 0 448 512" style="height:1em;width:0.88em;vertical-align:-0.125em;margin-left:auto;margin-right:auto;font-size:inherit;fill:currentColor;overflow:visible;position:relative;"><path d="M400 480H48c-26.51 0-48-21.49-48-48V80c0-26.51 21.49-48 48-48h352c26.51 0 48 21.49 48 48v352c0 26.51-21.49 48-48 48zm-204.686-98.059l184-184c6.248-6.248 6.248-16.379 0-22.627l-22.627-22.627c-6.248-6.248-16.379-6.249-22.628 0L184 302.745l-70.059-70.059c-6.248-6.248-16.379-6.248-22.628 0l-22.627 22.627c-6.248 6.248-6.248 16.379 0 22.627l104 104c6.249 6.25 16.379 6.25 22.628.001z"/></svg> **[Session 4](https://shaziaruybal.github.io/covidClassifyR-workshop/sessions/2022-03-11-session4/index.html)** gave you an overview of how to prepare and import your data to the [`covidClassifyR`](https://shaziaruybal.shinyapps.io/covidclassifyr) Shiny app -- #### <svg aria-hidden="true" role="img" viewBox="0 0 448 512" style="height:1em;width:0.88em;vertical-align:-0.125em;margin-left:auto;margin-right:auto;font-size:inherit;fill:currentColor;overflow:visible;position:relative;"><path d="M400 480H48c-26.51 0-48-21.49-48-48V80c0-26.51 21.49-48 48-48h352c26.51 0 48 21.49 48 48v352c0 26.51-21.49 48-48 48zm-204.686-98.059l184-184c6.248-6.248 6.248-16.379 0-22.627l-22.627-22.627c-6.248-6.248-16.379-6.249-22.628 0L184 302.745l-70.059-70.059c-6.248-6.248-16.379-6.248-22.628 0l-22.627 22.627c-6.248 6.248-6.248 16.379 0 22.627l104 104c6.249 6.25 16.379 6.25 22.628.001z"/></svg> **[Session 5](https://shaziaruybal.github.io/covidClassifyR-workshop/sessions/2022-03-11-session5/index.html)** gave you an overview of how to prepare your data and upload your data to the [`covidClassifyR`](https://shaziaruybal.shinyapps.io/covidclassifyr) app, and how to check the Luminex run info, raw data file and user-supplied plate layout -- .footnote[ For all the workshop materials see the [workshop website <svg aria-hidden="true" role="img" viewBox="0 0 512 512" style="height:1em;width:1em;vertical-align:-0.125em;margin-left:auto;margin-right:auto;font-size:inherit;fill:currentColor;overflow:visible;position:relative;"><path d="M432,320H400a16,16,0,0,0-16,16V448H64V128H208a16,16,0,0,0,16-16V80a16,16,0,0,0-16-16H48A48,48,0,0,0,0,112V464a48,48,0,0,0,48,48H400a48,48,0,0,0,48-48V336A16,16,0,0,0,432,320ZM488,0h-128c-21.37,0-32.05,25.91-17,41l35.73,35.73L135,320.37a24,24,0,0,0,0,34L157.67,377a24,24,0,0,0,34,0L435.28,133.32,471,169c15,15,41,4.5,41-17V24A24,24,0,0,0,488,0Z"/></svg>](https://shaziaruybal.github.io/covidClassifyR-workshop/materials.html) ] --- class: center # <svg aria-hidden="true" role="img" viewBox="0 0 640 512" style="height:1em;width:1.25em;vertical-align:-0.125em;margin-left:auto;margin-right:auto;font-size:inherit;fill:currentColor;overflow:visible;position:relative;"><path d="M96 64h448v352h64V40c0-22.06-17.94-40-40-40H72C49.94 0 32 17.94 32 40v376h64V64zm528 384H480v-64H288v64H16c-8.84 0-16 7.16-16 16v32c0 8.84 7.16 16 16 16h608c8.84 0 16-7.16 16-16v-32c0-8.84-7.16-16-16-16z"/></svg> # Today we will cover: -- ### How to download your processed data -- ### How to download and interpret your QC report -- ### You can find the app [here <svg aria-hidden="true" role="img" viewBox="0 0 512 512" style="height:1em;width:1em;vertical-align:-0.125em;margin-left:auto;margin-right:auto;font-size:inherit;fill:currentColor;overflow:visible;position:relative;"><path d="M432,320H400a16,16,0,0,0-16,16V448H64V128H208a16,16,0,0,0,16-16V80a16,16,0,0,0-16-16H48A48,48,0,0,0,0,112V464a48,48,0,0,0,48,48H400a48,48,0,0,0,48-48V336A16,16,0,0,0,432,320ZM488,0h-128c-21.37,0-32.05,25.91-17,41l35.73,35.73L135,320.37a24,24,0,0,0,0,34L157.67,377a24,24,0,0,0,34,0L435.28,133.32,471,169c15,15,41,4.5,41-17V24A24,24,0,0,0,488,0Z"/></svg>](https://shaziaruybal.shinyapps.io/covidClassifyR) --- class: inverse, center, middle # <svg aria-hidden="true" role="img" viewBox="0 0 512 512" style="height:1em;width:1em;vertical-align:-0.125em;margin-left:auto;margin-right:auto;font-size:inherit;fill:currentColor;overflow:visible;position:relative;"><path d="M216 0h80c13.3 0 24 10.7 24 24v168h87.7c17.8 0 26.7 21.5 14.1 34.1L269.7 378.3c-7.5 7.5-19.8 7.5-27.3 0L90.1 226.1c-12.6-12.6-3.7-34.1 14.1-34.1H192V24c0-13.3 10.7-24 24-24zm296 376v112c0 13.3-10.7 24-24 24H24c-13.3 0-24-10.7-24-24V376c0-13.3 10.7-24 24-24h146.7l49 49c20.1 20.1 52.5 20.1 72.6 0l49-49H488c13.3 0 24 10.7 24 24zm-124 88c0-11-9-20-20-20s-20 9-20 20 9 20 20 20 20-9 20-20zm64 0c0-11-9-20-20-20s-20 9-20 20 9 20 20 20 20-9 20-20z"/></svg> ## Downloading your data -- #### The example output data can be downloaded [here <svg aria-hidden="true" role="img" viewBox="0 0 512 512" style="height:1em;width:1em;vertical-align:-0.125em;margin-left:auto;margin-right:auto;font-size:inherit;fill:currentColor;overflow:visible;position:relative;"><path d="M432,320H400a16,16,0,0,0-16,16V448H64V128H208a16,16,0,0,0,16-16V80a16,16,0,0,0-16-16H48A48,48,0,0,0,0,112V464a48,48,0,0,0,48,48H400a48,48,0,0,0,48-48V336A16,16,0,0,0,432,320ZM488,0h-128c-21.37,0-32.05,25.91-17,41l35.73,35.73L135,320.37a24,24,0,0,0,0,34L157.67,377a24,24,0,0,0,34,0L435.28,133.32,471,169c15,15,41,4.5,41-17V24A24,24,0,0,0,488,0Z"/></svg>](https://shaziaruybal.shinyapps.io/covidClassifyR/_w_8c7cb1cd/output_tutorial.zip) --- ## <svg aria-hidden="true" role="img" viewBox="0 0 512 512" style="height:1em;width:1em;vertical-align:-0.125em;margin-left:auto;margin-right:auto;font-size:inherit;fill:currentColor;overflow:visible;position:relative;"><path d="M216 0h80c13.3 0 24 10.7 24 24v168h87.7c17.8 0 26.7 21.5 14.1 34.1L269.7 378.3c-7.5 7.5-19.8 7.5-27.3 0L90.1 226.1c-12.6-12.6-3.7-34.1 14.1-34.1H192V24c0-13.3 10.7-24 24-24zm296 376v112c0 13.3-10.7 24-24 24H24c-13.3 0-24-10.7-24-24V376c0-13.3 10.7-24 24-24h146.7l49 49c20.1 20.1 52.5 20.1 72.6 0l49-49H488c13.3 0 24 10.7 24 24zm-124 88c0-11-9-20-20-20s-20 9-20 20 9 20 20 20 20-9 20-20zm64 0c0-11-9-20-20-20s-20 9-20 20 9 20 20 20 20-9 20-20z"/></svg> Downloading your data .panelset.sideways[ .panel[.panel-name[Download tab]  ] .panel[.panel-name[Processed MFI/RAU data] .left-column[ You can download your processed data by clicking on the button “Download MFI/RAU data”. This will be a .csv file of the antigen-specific MFI and RAU ("Dilution") values for each sample. This file is the same as the table in the "Sample results" tab. ] .right-column[  ] ] .panel[.panel-name[Standard curve data] .left-column[ In some cases it may be useful to compare your standard curve data across multiple plate runs, so you can also download the standard curve data separately by clicking the button “Download standard curve data”. This will be a .csv file of the antigen-specific MFI values for each standard sample (unprocessed). ] .right-column[  ] ] .panel[.panel-name[Quality control report] .left-column[ You can download your quality control report, which includes all of the plots in the Quality control tab as well as the information you entered in the Import data tab (i.e. experiment name, notes, date and uploaded files). **<svg aria-hidden="true" role="img" viewBox="0 0 352 512" style="height:1em;width:0.69em;vertical-align:-0.125em;margin-left:auto;margin-right:auto;font-size:inherit;fill:currentColor;overflow:visible;position:relative;"><path d="M96.06 454.35c.01 6.29 1.87 12.45 5.36 17.69l17.09 25.69a31.99 31.99 0 0 0 26.64 14.28h61.71a31.99 31.99 0 0 0 26.64-14.28l17.09-25.69a31.989 31.989 0 0 0 5.36-17.69l.04-38.35H96.01l.05 38.35zM0 176c0 44.37 16.45 84.85 43.56 115.78 16.52 18.85 42.36 58.23 52.21 91.45.04.26.07.52.11.78h160.24c.04-.26.07-.51.11-.78 9.85-33.22 35.69-72.6 52.21-91.45C335.55 260.85 352 220.37 352 176 352 78.61 272.91-.3 175.45 0 73.44.31 0 82.97 0 176zm176-80c-44.11 0-80 35.89-80 80 0 8.84-7.16 16-16 16s-16-7.16-16-16c0-61.76 50.24-112 112-112 8.84 0 16 7.16 16 16s-7.16 16-16 16z"/></svg> Tip:** The QC report is an .html file and is best viewed on a computer browser. ] .right-column[  ] ] ] --- # <svg aria-hidden="true" role="img" viewBox="0 0 640 512" style="height:1em;width:1.25em;vertical-align:-0.125em;margin-left:auto;margin-right:auto;font-size:inherit;fill:currentColor;overflow:visible;position:relative;"><path d="M240 384c-8.8 0-16 7.2-16 16s7.2 16 16 16 16-7.2 16-16-7.2-16-16-16zm160 32c8.8 0 16-7.2 16-16s-7.2-16-16-16-16 7.2-16 16 7.2 16 16 16zM624 0H16C7.2 0 0 7.2 0 16v32c0 8.8 7.2 16 16 16h608c8.8 0 16-7.2 16-16V16c0-8.8-7.2-16-16-16zm0 448h-48V96H64v352H16c-8.8 0-16 7.2-16 16v32c0 8.8 7.2 16 16 16h608c8.8 0 16-7.2 16-16v-32c0-8.8-7.2-16-16-16zM480 248c0 4.4-3.6 8-8 8H336v32h104c4.4 0 8 3.6 8 8v16c0 4.4-3.6 8-8 8H336v32h64c26.5 0 48 21.5 48 48s-21.5 48-48 48-48-21.5-48-48v-16h-64v16c0 26.5-21.5 48-48 48s-48-21.5-48-48 21.5-48 48-48h64v-32H200c-4.4 0-8-3.6-8-8v-16c0-4.4 3.6-8 8-8h104v-32H168c-4.4 0-8-3.6-8-8v-16c0-4.4 3.6-8 8-8h136v-32H200c-4.4 0-8-3.6-8-8v-16c0-4.4 3.6-8 8-8h104v-24c0-4.4 3.6-8 8-8h16c4.4 0 8 3.6 8 8v24h104c4.4 0 8 3.6 8 8v16c0 4.4-3.6 8-8 8H336v32h136c4.4 0 8 3.6 8 8v16z"/></svg> The anatomy of the QC report <video width="1330" height="410" controls> <source src="img/qc_report.mp4" type="video/mp4"> </video> --- # <svg aria-hidden="true" role="img" viewBox="0 0 576 512" style="height:1em;width:1.12em;vertical-align:-0.125em;margin-left:auto;margin-right:auto;font-size:inherit;fill:currentColor;overflow:visible;position:relative;"><path d="M542.22 32.05c-54.8 3.11-163.72 14.43-230.96 55.59-4.64 2.84-7.27 7.89-7.27 13.17v363.87c0 11.55 12.63 18.85 23.28 13.49 69.18-34.82 169.23-44.32 218.7-46.92 16.89-.89 30.02-14.43 30.02-30.66V62.75c.01-17.71-15.35-31.74-33.77-30.7zM264.73 87.64C197.5 46.48 88.58 35.17 33.78 32.05 15.36 31.01 0 45.04 0 62.75V400.6c0 16.24 13.13 29.78 30.02 30.66 49.49 2.6 149.59 12.11 218.77 46.95 10.62 5.35 23.21-1.94 23.21-13.46V100.63c0-5.29-2.62-10.14-7.27-12.99z"/></svg> Your homework for next time -- ### <svg aria-hidden="true" role="img" viewBox="0 0 448 512" style="height:1em;width:0.88em;vertical-align:-0.125em;margin-left:auto;margin-right:auto;font-size:inherit;fill:currentColor;overflow:visible;position:relative;"><path d="M400 480H48c-26.51 0-48-21.49-48-48V80c0-26.51 21.49-48 48-48h352c26.51 0 48 21.49 48 48v352c0 26.51-21.49 48-48 48zm-204.686-98.059l184-184c6.248-6.248 6.248-16.379 0-22.627l-22.627-22.627c-6.248-6.248-16.379-6.249-22.628 0L184 302.745l-70.059-70.059c-6.248-6.248-16.379-6.248-22.628 0l-22.627 22.627c-6.248 6.248-6.248 16.379 0 22.627l104 104c6.249 6.25 16.379 6.25 22.628.001z"/></svg> Download the [example raw data <svg aria-hidden="true" role="img" viewBox="0 0 512 512" style="height:1em;width:1em;vertical-align:-0.125em;margin-left:auto;margin-right:auto;font-size:inherit;fill:currentColor;overflow:visible;position:relative;"><path d="M432,320H400a16,16,0,0,0-16,16V448H64V128H208a16,16,0,0,0,16-16V80a16,16,0,0,0-16-16H48A48,48,0,0,0,0,112V464a48,48,0,0,0,48,48H400a48,48,0,0,0,48-48V336A16,16,0,0,0,432,320ZM488,0h-128c-21.37,0-32.05,25.91-17,41l35.73,35.73L135,320.37a24,24,0,0,0,0,34L157.67,377a24,24,0,0,0,34,0L435.28,133.32,471,169c15,15,41,4.5,41-17V24A24,24,0,0,0,488,0Z"/></svg>](https://shaziaruybal.shinyapps.io/covidClassifyR/_w_8c7cb1cd/example_data.zip) if you haven't already -- ### <svg aria-hidden="true" role="img" viewBox="0 0 448 512" style="height:1em;width:0.88em;vertical-align:-0.125em;margin-left:auto;margin-right:auto;font-size:inherit;fill:currentColor;overflow:visible;position:relative;"><path d="M400 480H48c-26.51 0-48-21.49-48-48V80c0-26.51 21.49-48 48-48h352c26.51 0 48 21.49 48 48v352c0 26.51-21.49 48-48 48zm-204.686-98.059l184-184c6.248-6.248 6.248-16.379 0-22.627l-22.627-22.627c-6.248-6.248-16.379-6.249-22.628 0L184 302.745l-70.059-70.059c-6.248-6.248-16.379-6.248-22.628 0l-22.627 22.627c-6.248 6.248-6.248 16.379 0 22.627l104 104c6.249 6.25 16.379 6.25 22.628.001z"/></svg> If you haven't already, import the raw data and plate layout and go through the QC -- ### <svg aria-hidden="true" role="img" viewBox="0 0 448 512" style="height:1em;width:0.88em;vertical-align:-0.125em;margin-left:auto;margin-right:auto;font-size:inherit;fill:currentColor;overflow:visible;position:relative;"><path d="M400 480H48c-26.51 0-48-21.49-48-48V80c0-26.51 21.49-48 48-48h352c26.51 0 48 21.49 48 48v352c0 26.51-21.49 48-48 48zm-204.686-98.059l184-184c6.248-6.248 6.248-16.379 0-22.627l-22.627-22.627c-6.248-6.248-16.379-6.249-22.628 0L184 302.745l-70.059-70.059c-6.248-6.248-16.379-6.248-22.628 0l-22.627 22.627c-6.248 6.248-6.248 16.379 0 22.627l104 104c6.249 6.25 16.379 6.25 22.628.001z"/></svg> Download the [example output data <svg aria-hidden="true" role="img" viewBox="0 0 512 512" style="height:1em;width:1em;vertical-align:-0.125em;margin-left:auto;margin-right:auto;font-size:inherit;fill:currentColor;overflow:visible;position:relative;"><path d="M432,320H400a16,16,0,0,0-16,16V448H64V128H208a16,16,0,0,0,16-16V80a16,16,0,0,0-16-16H48A48,48,0,0,0,0,112V464a48,48,0,0,0,48,48H400a48,48,0,0,0,48-48V336A16,16,0,0,0,432,320ZM488,0h-128c-21.37,0-32.05,25.91-17,41l35.73,35.73L135,320.37a24,24,0,0,0,0,34L157.67,377a24,24,0,0,0,34,0L435.28,133.32,471,169c15,15,41,4.5,41-17V24A24,24,0,0,0,488,0Z"/></svg>](https://shaziaruybal.shinyapps.io/covidClassifyR/_w_8c7cb1cd/output_tutorial.zip) for the next session -- #### <svg aria-hidden="true" role="img" viewBox="0 0 576 512" style="height:1em;width:1.12em;vertical-align:-0.125em;margin-left:auto;margin-right:auto;font-size:inherit;fill:currentColor;overflow:visible;position:relative;"><path d="M259.3 17.8L194 150.2 47.9 171.5c-26.2 3.8-36.7 36.1-17.7 54.6l105.7 103-25 145.5c-4.5 26.3 23.2 46 46.4 33.7L288 439.6l130.7 68.7c23.2 12.2 50.9-7.4 46.4-33.7l-25-145.5 105.7-103c19-18.5 8.5-50.8-17.7-54.6L382 150.2 316.7 17.8c-11.7-23.6-45.6-23.9-57.4 0z"/></svg> Bonus: try changing the experiment info, date and notes and download the processed data and QC --- class: inverse, middle, center # <svg aria-hidden="true" role="img" viewBox="0 0 384 512" style="height:1em;width:0.75em;vertical-align:-0.125em;margin-left:auto;margin-right:auto;font-size:inherit;fill:currentColor;overflow:visible;position:relative;"><path d="M336 64h-80c0-35.3-28.7-64-64-64s-64 28.7-64 64H48C21.5 64 0 85.5 0 112v352c0 26.5 21.5 48 48 48h288c26.5 0 48-21.5 48-48V112c0-26.5-21.5-48-48-48zM192 40c13.3 0 24 10.7 24 24s-10.7 24-24 24-24-10.7-24-24 10.7-24 24-24zm121.2 231.8l-143 141.8c-4.7 4.7-12.3 4.6-17-.1l-82.6-83.3c-4.7-4.7-4.6-12.3.1-17L99.1 285c4.7-4.7 12.3-4.6 17 .1l46 46.4 106-105.2c4.7-4.7 12.3-4.6 17 .1l28.2 28.4c4.7 4.8 4.6 12.3-.1 17z"/></svg> ## Next session: ### Introduction to the classification algorithm --- # Acknowledgments - Dr Maria Ome-Kaius and Dr Fiona Angrisano - PNGIMR and partner institutions - WEHI & Burnet Institute - All of you for attending! *We are extremely grateful for financial support to develop and host the covidClassifyR Shiny web application, and to host these virtual workshops through the [Regional Collaborations Programme COVID-19 Digital Grant](https://www.science.org.au/news-and-events/news-and-media-releases/regional-research-set-get-digital-boost) from the Australian Academy of Science and Australian Department of Industry, Science, Energy and Resources.* The scripts and functions used in [`covidClassifyR`](https://shaziaruybal.shinyapps.io/covidclassifyr) were developed by Shazia Ruybal-Pesántez, with contributions from the following researchers: Eamon Conway, Connie Li Wan Suen, Narimane Nekkab and Michael White. .footnote[ _These slides were created using the R packages: [xaringan](https://github.com/yihui/xaringan), [xaringanthemer](https://github.com/gadenbuie/xaringanthemer), [xaringanExtra](https://github.com/gadenbuie/xaringanExtra)_ ] --- name: contact class: inverse .pull-left[ .center[ ### Dr Shazia Ruybal-Pesántez <img style="border-radius: 50%;" src="https://shaziaruybal.github.io/covidClassifyR-workshop/images/shazia.png" width="250px"/> #### Contact details [<svg aria-hidden="true" role="img" viewBox="0 0 512 512" style="height:1em;width:1em;vertical-align:-0.125em;margin-left:auto;margin-right:auto;font-size:inherit;fill:currentColor;overflow:visible;position:relative;"><path d="M502.3 190.8c3.9-3.1 9.7-.2 9.7 4.7V400c0 26.5-21.5 48-48 48H48c-26.5 0-48-21.5-48-48V195.6c0-5 5.7-7.8 9.7-4.7 22.4 17.4 52.1 39.5 154.1 113.6 21.1 15.4 56.7 47.8 92.2 47.6 35.7.3 72-32.8 92.3-47.6 102-74.1 131.6-96.3 154-113.7zM256 320c23.2.4 56.6-29.2 73.4-41.4 132.7-96.3 142.8-104.7 173.4-128.7 5.8-4.5 9.2-11.5 9.2-18.9v-19c0-26.5-21.5-48-48-48H48C21.5 64 0 85.5 0 112v19c0 7.4 3.4 14.3 9.2 18.9 30.6 23.9 40.7 32.4 173.4 128.7 16.8 12.2 50.2 41.8 73.4 41.4z"/></svg> ruybal.s@wehi.edu.au](mailto:ruybal.s@wehi.edu.au) [<svg aria-hidden="true" role="img" viewBox="0 0 512 512" style="height:1em;width:1em;vertical-align:-0.125em;margin-left:auto;margin-right:auto;font-size:inherit;fill:currentColor;overflow:visible;position:relative;"><path d="M459.37 151.716c.325 4.548.325 9.097.325 13.645 0 138.72-105.583 298.558-298.558 298.558-59.452 0-114.68-17.219-161.137-47.106 8.447.974 16.568 1.299 25.34 1.299 49.055 0 94.213-16.568 130.274-44.832-46.132-.975-84.792-31.188-98.112-72.772 6.498.974 12.995 1.624 19.818 1.624 9.421 0 18.843-1.3 27.614-3.573-48.081-9.747-84.143-51.98-84.143-102.985v-1.299c13.969 7.797 30.214 12.67 47.431 13.319-28.264-18.843-46.781-51.005-46.781-87.391 0-19.492 5.197-37.36 14.294-52.954 51.655 63.675 129.3 105.258 216.365 109.807-1.624-7.797-2.599-15.918-2.599-24.04 0-57.828 46.782-104.934 104.934-104.934 30.213 0 57.502 12.67 76.67 33.137 23.715-4.548 46.456-13.32 66.599-25.34-7.798 24.366-24.366 44.833-46.132 57.827 21.117-2.273 41.584-8.122 60.426-16.243-14.292 20.791-32.161 39.308-52.628 54.253z"/></svg> @DrShaziaRuybal](https://twitter.com/DrShaziaRuybal) ]] .pull-right[ ### Session 6 Resources: ### [<i class="fab fa-youtube "></i> Recording](https://youtu.be/qCXLwPhXbA8) ### [<i class="fas fa-laptop-code "></i> `covidClassifyR`](https://shaziaruybal.shinyapps.io/covidClassifyR) ### [<svg aria-hidden="true" role="img" viewBox="0 0 496 512" style="height:1em;width:0.97em;vertical-align:-0.125em;margin-left:auto;margin-right:auto;font-size:inherit;fill:currentColor;overflow:visible;position:relative;"><path d="M336.5 160C322 70.7 287.8 8 248 8s-74 62.7-88.5 152h177zM152 256c0 22.2 1.2 43.5 3.3 64h185.3c2.1-20.5 3.3-41.8 3.3-64s-1.2-43.5-3.3-64H155.3c-2.1 20.5-3.3 41.8-3.3 64zm324.7-96c-28.6-67.9-86.5-120.4-158-141.6 24.4 33.8 41.2 84.7 50 141.6h108zM177.2 18.4C105.8 39.6 47.8 92.1 19.3 160h108c8.7-56.9 25.5-107.8 49.9-141.6zM487.4 192H372.7c2.1 21 3.3 42.5 3.3 64s-1.2 43-3.3 64h114.6c5.5-20.5 8.6-41.8 8.6-64s-3.1-43.5-8.5-64zM120 256c0-21.5 1.2-43 3.3-64H8.6C3.2 212.5 0 233.8 0 256s3.2 43.5 8.6 64h114.6c-2-21-3.2-42.5-3.2-64zm39.5 96c14.5 89.3 48.7 152 88.5 152s74-62.7 88.5-152h-177zm159.3 141.6c71.4-21.2 129.4-73.7 158-141.6h-108c-8.8 56.9-25.6 107.8-50 141.6zM19.3 352c28.6 67.9 86.5 120.4 158 141.6-24.4-33.8-41.2-84.7-50-141.6h-108z"/></svg> Workshop materials](https://shaziaruybal.github.io/covidClassifyR-workshop/materials.html) ### [<svg aria-hidden="true" role="img" viewBox="0 0 512 512" style="height:1em;width:1em;vertical-align:-0.125em;margin-left:auto;margin-right:auto;font-size:inherit;fill:currentColor;overflow:visible;position:relative;"><path d="M464 448H48c-26.51 0-48-21.49-48-48V112c0-26.51 21.49-48 48-48h416c26.51 0 48 21.49 48 48v288c0 26.51-21.49 48-48 48zM112 120c-30.928 0-56 25.072-56 56s25.072 56 56 56 56-25.072 56-56-25.072-56-56-56zM64 384h384V272l-87.515-87.515c-4.686-4.686-12.284-4.686-16.971 0L208 320l-55.515-55.515c-4.686-4.686-12.284-4.686-16.971 0L64 336v48z"/></svg> Slides for Session 6](https://shaziaruybal.github.io/covidClassifyR-workshop/slides/session6/session6_slides.html) ] --- class: inverse, middle, center # <svg aria-hidden="true" role="img" viewBox="0 0 512 512" style="height:1em;width:1em;vertical-align:-0.125em;margin-left:auto;margin-right:auto;font-size:inherit;fill:currentColor;overflow:visible;position:relative;"><path d="M504 256c0 136.997-111.043 248-248 248S8 392.997 8 256C8 119.083 119.043 8 256 8s248 111.083 248 248zM262.655 90c-54.497 0-89.255 22.957-116.549 63.758-3.536 5.286-2.353 12.415 2.715 16.258l34.699 26.31c5.205 3.947 12.621 3.008 16.665-2.122 17.864-22.658 30.113-35.797 57.303-35.797 20.429 0 45.698 13.148 45.698 32.958 0 14.976-12.363 22.667-32.534 33.976C247.128 238.528 216 254.941 216 296v4c0 6.627 5.373 12 12 12h56c6.627 0 12-5.373 12-12v-1.333c0-28.462 83.186-29.647 83.186-106.667 0-58.002-60.165-102-116.531-102zM256 338c-25.365 0-46 20.635-46 46 0 25.364 20.635 46 46 46s46-20.636 46-46c0-25.365-20.635-46-46-46z"/></svg> Questions?